
Back to the
70s
On a few occasions we've discussed
the similarities between the current bull market in gold stocks and the
1972-1974 gold-stock bull market. A couple of weeks ago we also reviewed
the relative performances of the Dow, the US$ and the gold price during
the 1972-1974 period and showed that the period from May to July of 1973
was strikingly similar to the 2-month period that began in late-May of
this year. In both cases the gold price pulled back even as the Dow
continued to grind lower and the US$ plunged. Now we are going to look
at a couple of differences between then (1973) and now.
Below is a chart comparing the performance
of gold stocks (as represented by the Barrons Gold Mining Index) with the
gold price during 1972-1974 (thanks to Mark L for his work in compiling
the Barrons data). Notice that the gold price made a short-term peak at
the beginning of May 1973 and that between May and July of 1973 (the period
between the vertical green lines on the chart) the gold price drifted lower
as the prices of gold stocks continued to surge higher. As mentioned above,
during this period the Dow and the $ were falling so gold stocks were ignoring
the gold price and were, instead, responding to the goings-on in the currency
and stock markets. This is, of course, very different from what has happened
over the past 2 months.
Over the recent past gold stocks have
fallen concurrently with US$ and stock market weakness and have thus behaved
in a totally different manner to how they behaved during May-July of 1973.
We think the following chart explains why this has happened. The chart
is an updated version of our comparison between the Barrons Gold Mining
Index during 1972-1974 (the blue line) and the HUI since November of 2000
(the pink line).
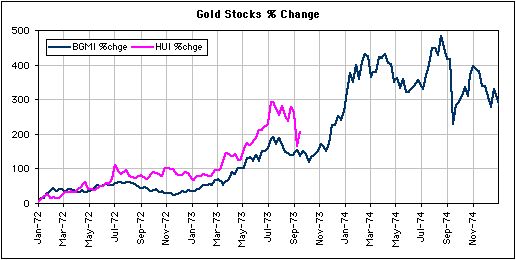
The peak in the HUI that occurred in
late-May of this year lines-up almost perfectly with the peak in the Barrons
Gold Mining Index (BGMI) that occurred in early-July of 1973. However,
note that when the HUI peaked earlier this year it was well ahead of where
the BGMI was at its July-1973 peak. The out-performance of the HUI during
2000-2002 seems even more remarkable when we consider that the surge in
gold-stock prices between January-1972 and July-1973 was accompanied by
a 150% increase in the gold price whereas the surge in gold-stock prices
between November-2000 and May-2002 was accompanied by only a 30% increase
in the gold price.
In our view, the recent sharp declines
in the prices of gold and silver shares are primarily a consequence of
how far they had moved up and how expensive they had become relative to
the prices of gold and silver bullion. As the above chart shows, even after
its recent plunge the HUI is still ahead of where the Barrons Gold Mining
Index was at a similar stage of the 1972-1974 bull market.
Regular financial market forecasts
and
analyses are provided at our web site:
http://www.speculative-investor.com/new/index.html
One-month free trial available.

|
