Learning From
History
Here is an extract from commentary
that was posted at www.speculative-investor.com on 11th July 2002.
Markets are complex. Over the short-term
they often do the exact opposite of what they 'should' be doing based on
conventional wisdom. This is partly because the financial markets are always
trying to anticipate tomorrow's news rather than react to today's news,
but it is also the nature of markets to keep the majority of participants
off balance most of the time.
We've been using the gold stock rally
of the early-1970s as a rough guide as to what could reasonably be expected
from the current bull market (the one that began in November of 2000).
As we've shown in the past, the path that has been followed by gold stocks
since November of 2000 is remarkably similar to the path that was followed
by gold stocks during the rally that commenced in January of 1972. Furthermore,
the correction in the gold market that began in late-May of this year lines
up quite closely with the 3-month correction that began at the beginning
of May in 1973. Via the following chart, let's now take a look at how the
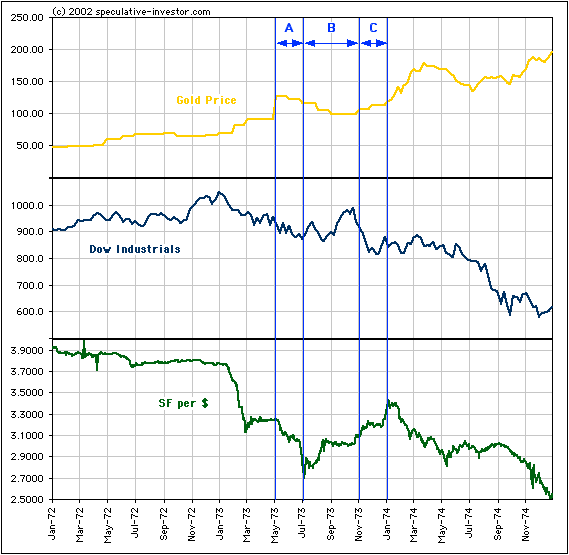
gold price, the Dow Industrials Index and the US$ moved in relation to
each other during 1972-1974, paying particular attention to what happened
between May and November of 1973.

The above chart shows that the gold
price trended higher throughout 1972-1974 as the Dow and the Dollar trended
lower (we've used the Swiss Franc-US$ exchange rate to represent the performance
of the Dollar). This is, of course, what we would expect to see and also
matches what has happened over the past 18 months (most people mistakenly
think that Dollar weakness is something that has just happened over the
past few months, but the Swiss Franc actually began trending higher against
the US$ in October of 2000). Now, zooming in on the period beginning in
May of 1973, what we see is:
1) The gold price peaked at the start
of May, 1973. The gold price then spent the next 2 months drifting lower
(period 'A' on the chart) even as the Dow continued to fall and the US$
plunged.
2) Between July and November of 1973
(period 'B' on the chart) the Dow and the $ experienced counter-trend rallies
while the gold price continued to consolidate.
3) Between November of 1973 and January
of 1974 (period 'C' on the chart) the gold price began the next upward
leg in its bull market even as the $ continued to move higher.
There are obvious similarities between
the first stage of the 1973 gold market correction and what has happened
to date during the correction that began in late-May of this year. As far
as we know there was no cartel of bullion banks to blame for the apparently
anomalous behaviour of the gold price during May and June of 1973. Furthermore,
the US and the IMF didn't begin their gold sales until 1975 and the swapping/lending
of gold was not popular at that time. So, why did gold and gold stocks
fall during May-June 1973 even though the stock market and the US$ continued
to weaken? How about the simple fact that markets don't go up in a straight
line. Even the most powerful of bull markets experience substantial corrections
from time to time and these corrections often happen when the fundamentals
appear to be more bullish than ever.
Studying what has happened in the past
doesn't tell us what will happen in the future, but it does help us set
our expectations as to what is both possible and reasonable. It should
also prevent us from being surprised when markets don't do the obvious.
Regular financial market forecasts
and
analyses are provided at our web site:
http://www.speculative-investor.com/new/index.html
One-month free trial available.

|

