US$ downtrend
to resume shortly
Here is an extract from commentary
that was posted at www.speculative-investor.com on 27th October 2002.
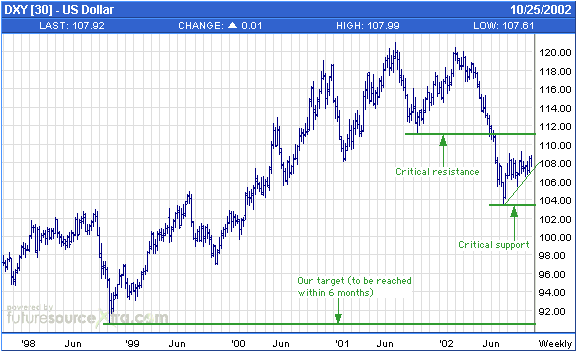
Below is a weekly chart of the Dollar
Index. The Dollar experienced a large decline during the first 7 months
of this year and has since been drifting higher in what looks like a counter-trend
consolidation.

Chart Source: http://www.futuresource.com/
The Dollar Index is presently about
mid way between critical support defined by the July-2002 low (around 103.50)
and critical resistance defined by the September-2001 low (around 111).
Our view, over the past 3 months, has been that the Dollar Index would
move up to the 111-112 range before commencing the next downward leg in
its bear market. Also, based on cyclical patterns weíve thought that additional
major downside in the Dollar would probably be delayed until the first
quarter of next year. We are now going to make a couple of adjustments
to these views.
First, rather than look for a rally
to 111-112 over the coming 2 months, we will re-state our short-term view
as follows: The Dollar Index will not achieve a weekly close above 111.
We are making this change because the Dollar Index has completely worked-off
an 'oversold' condition over the past 3 months, yet it is now only about
3% above its July low. It is a sign of weakness that such a large decline
would be followed by such a feeble bounce. Also, the importance of the
resistance at around 111 is such that a decisive close above this resistance
would call into question our medium-term bearish view on the Dollar.
Second, there are good reasons to expect
that normal seasonal forces will not 'work' this year. One of these seasonal
forces is the tendency for the stock market to perform well between the
months of November and April. However, this seasonal tendency has been
determined primarily by looking at what happened when the investment environment
was totally different from today's environment. If we look at what happened
during comparable investment environments the same seasonal pattern does
not emerge. For example, the following periods were lousy times to be heavily
invested in the stock market:
Nov-1930 to Apr-1931
Nov-1931 to Apr-1932
Nov-1932 to Apr-1933
Nov-2000 to Apr-2001
The period from Nov-2001 to Apr-2002
was a reasonable, although certainly not great, time to be invested, but
this was because there was a major selling climax in September of 2001.
This year there has been no such climax and, therefore, the stock market
has considerable downside risk over the next several months.
Since there is a good chance that the
stock market is not going to follow the normal seasonal pattern this year
and since the US$ is positively correlated with the US stock market, it
is not much of a stretch to conclude that the Dollar's typical 4th quarter
strength might be absent this year. We therefore won't be relying on the
Dollar's normal seasonal pattern to delay the start of the next downward
leg in its bear market.
The US$ made its long-term peak against
both the SF and the euro on 26th October 2000, so we have just had the
2-year anniversary of this milestone. This 2-year anniversary won't be
especially significant unless the Dollar immediately starts to show signs
of weakness. A daily close below 107 would be such a sign and would suggest
that the Dollar was about to move quickly down to its July low. A break
below the July low would indicate that the Dollar Index was on its way
to our medium-term target of 90.
Regular financial market forecasts
and
analyses are provided at our web site:
http://www.speculative-investor.com/new/index.html
One-month free trial available.

|

