![]()
![]()
![]()
![]()
-- Weekly Market Update for the Week Commencing 1st January 2018
Big Picture
View
Here is a summary of our big picture
view of the markets. Note that our short-term views may differ from our
big picture view.
The BULL market in US Treasury Bonds that began in the early 1980s ended in mid-2016, but there will be many years of topping action in bond prices and bottoming action in bond yields before major new trends get underway. A major decline in government bond prices will unfold during the 2020s. (Last update: 11 September 2017)
The stock market, as represented by the S&P500 Index, commenced a secular BEAR market during the first quarter of 2000, where "secular bear market" is defined as a long-term downward trend in valuations (P/E ratios, etc.), gold-denominated prices and inflation-adjusted prices. This secular trend will bottom in 2020 or later. (Last update: 11 September 2017)
A cyclical BEAR market in the US Dollar began in 2016-2017. (Last update: 11 September 2017)
Gold commenced a secular bull market relative to all fiat currencies, the CRB Index, bonds and most stock market indices during 1999-2001. This secular trend will peak in 2020 or later. (Last update: 11 September 2017)
Commodities,
as represented by the CRB Index, commenced a
secular BULL market in 2001 in nominal dollar terms. The first major
upward leg in this bull market ended during the first half of 2008, but
a long-term peak won't occur until 2020 or later.
(Last
update: 11 September 2017)
Copyright
Reminder
The commentaries that appear at TSI
may not be distributed, in full or in part, without our written permission.
In particular, please note that the posting of extracts from TSI commentaries
at other web sites or providing links to TSI commentaries at other web
sites (for example, at discussion boards) without our written permission
is prohibited.
We reserve the right to immediately
terminate the subscription of any TSI subscriber who distributes the TSI
commentaries without our written permission.
True
Fundamentals Summary
[Notes:
1) The date shown next to the current True Fundamentals Model (TFM) signal is
when the most recent change occurred. 2) Charts of the Gold and Equity
TFMs are included in the "Charts and Indicators" section of the TSI web
site]
| Market | True Fundamentals Model (TFM) |
| Gold (US$ Price) | Bullish (29 Dec 2017) |
| US Equity (SPX) | Bullish (29 Dec 2017) |
| Currency (Dollar Index) | Bullish (15 Dec 2017) |
| Commodities (GNX) | Bullish (29 Dec 2017) |
Last week's posts at the TSI Blog
It's not
a gold bull market
Summary of current
thinking/positioning
1) Thinking that gold has done
enough to confirm that its correction low was put in place on Tuesday 12th
December and that the 2016 high ($1377) will be tested during the first
half of 2018.
2) Expecting a tradable US stock-market correction to
begin soon and looking for an opportunity to add a bearish speculation
linked to the NASDAQ100 Index.
3) With the upward trends having
extended into year-end, now thinking that industrial commodities such as
oil and copper are more likely to make short-term highs than the
previously-expected correction lows during January-February.
4)
Thinking that the Dollar Index (DX) has resumed its longer-term downward
trend, but expecting a DX rebound to begin soon.
5) Thinking that
the T-Bond has almost completed a multi-month top within the context of a
long-term topping pattern.
6) Holding a reduced -- thanks to buying
opportunities that emerged over the past few weeks -- cash reserve of 25%.
Looking for opportunities to raise more cash.
Everything is
bullish, but not for long
Our fundamentals-focused models
for the US stock market, the gold market, the Dollar Index and commodities
were all bullish at the end of last week. This is a strange set of
circumstances that won't persist. There's a high probability that one or
two of these models will turn neutral or bearish during the first half of
January.
A further
reduction in the G2 monetary inflation rate
Our G2 (US plus euro-zone)
monetary inflation indicator edged below the 6% boom-bust threshold in
September and has since extended its downward trend. As at the end of
November it was 5.1%, which is its lowest level since September of 2008.
Based on what happened in 2000 and 2006-2007, 6-12 months can
transpire from monetary conditions shifting into bust territory and
evidence of a bust appearing in financial-market prices and/or economic
data. The junk bond market is the most likely place for this evidence to
first appear, although a trend reversal in the yield curve from flattening
to steepening will be the most reliable signal that a bust is about to
begin.
Commodities
EV (Electric Vehicle)
Metals
The gross
under-estimation of future EV demand
We are grouping copper,
nickel, cobalt, lithium and the REEs (Rare Earth Elements) together under
the name "EV Metals", because the demand for each of these metals will be
strongly influenced -- in a positive way -- over the next several years by
the increasing popularity of EVs. Although there is already a lot of
optimism about the demand growth for EVs and the associated metals, it's
likely that even the most optimistic projections made to date by the
analysts at major financial institutions will turn out to be far too
pessimistic. In our opinion, the mainstream financial world is greatly
under-estimating the speed with which EVs will come to dominate the
motor-vehicle market.
The most optimistic projection regarding EV
sales that we've seen is JP Morgan's estimate that EVs will have a 35%
share of the new car market by 2025. However, given that by 2025 an EV
will have much better performance, be much cheaper to run and maintain,
have a much longer useful life and be much cheaper to buy (without
government subsidies) than its ICE (Internal Combustion Engine)
counterpart, in addition to having a battery that can fully-recharge in
less the an hour and enable the car to run for hundreds of miles between
charges, who, by then, will be buying ICE vehicles? The answer is: almost
no-one.
It's likely that by 2025 the EV share of the new car market
will be close to 100%, at least in the parts of the world that should by
then have the necessary charging infrastructure (the US, Canada,
Australia, New Zealand, Japan, China, Hong Kong, Singapore, South Korea
and most of Europe). If so, over the next few years the demand for EV
Metals will ramp-up at a much faster pace than generally expected.
Interestingly, while the demand for EVs may well be much greater by the
early-to-mid-2020s than most analysts currently expect, by 2030 it may be
lower than generally expected at this time. The reason is a large
reduction in the number of cars due to the combination of EVs with useful
lives of a million miles, self-driving technology and ride-sharing. This
possibility was explained in a
mind-blowing
presentation given by Tony Seba.
Copper's strange performance
The copper price performed in
an extraordinary way during December. On the third trading day of the
month the price plunged through support. It then rose on 16 trading days
in succession before dropping by a solitary cent last Friday. A 16-day
winning streak is extremely uncommon in a liquid, globally-traded
commodity market, and the fact that the unusually-long run of up-days
began the day after a breach of support makes it even more of a rarity.
Copper's upward reversal in early-December and subsequent rally to a
new multi-year high is consistent with our intermediate-term outlook. It
is not consistent with our short-term outlook, though, as we were
expecting the correction that began in early-September to culminate in the
$2.80s during January or February.
It's likely that the low of the
next correction, which could begin at any time, will be above the December
low of $2.95.
Oil extends its short-term
rally
Due to the increasing usage of EVs, there's a good
chance that the global demand for oil will be significantly lower in a
decade from now than it is today. However, EVs won't have a big effect on
oil demand over the next 12 months.
Currently, the only fundamental
indicator that matters is oil-bullish. We are referring to the term
structure in the oil futures market (the prices of later-dated futures
relative to earlier-dated futures). The oil market is in "backwardation",
meaning that the earlier the futures-contract expiry date the higher the
price. This is indicative of a commodity market in which physical supply
is tight.
At the same time, the net speculative long position in
oil futures is larger than it has ever been, which suggests that the
current bullish supply-demand situation in the physical market has been
fully discounted. Also, the market is short-term 'overbought' and the
price is within $2 of intermediate-term resistance defined by the 2015
peak (refer to the chart displayed below).
The price chart and the
sentiment backdrop suggest that the oil price won't make much additional
headway before reaching a short-term top, but due to the bullish
fundamental situation we aren't tempted to bet against oil at this time.
A final point worth noting before we leave the oil market is that the
oil price has made a multi-month extreme during January-February in each
of the past three years. There were multi-month price lows in early-2015
and early-2016 and there was a multi-month price high in early-2017. Prior
to the past fortnight we thought that January-February of 2018 would
usher-in a correction low, thus setting the stage for strength into
mid-year. However, it is now clear that if there is going to be a
January-February turning point in 2018 it will be a turn from up to down.
Natural Gas (NG) reversal
US
natural gas futures broke out to the downside during the first half of
December, but last week there was an impressive upward reversal and the
downside breakout has been negated. The catalyst for the upward reversal
was colder-than-average winter temperatures -- leading to greater
heating-related demand -- in the northern and eastern parts of the US.
We have no opinion on what the NG price will do over the next few
weeks. As is often the case with this commodity, much will depend on the
vagaries of the weather.
Higher
interest rates are coming to a town near you
Over the past 12 months there were many weeks that the US Treasury Bond
market made a significant move. For example, during the week before last
there was a significant decline in bond prices (rise in bond yields) and
last week there was a significant rise in bond prices (decline in bond
yields). However, the net result of all these weekly moves was a market
that essentially went nowhere.
The following chart of the 30-year
T-Bond price illustrates what we mean. Notice that there was a large
decline in the T-Bond price during the second half of 2016 and that 2017
contained many short/sharp moves that ended up cancelling each other out.
When a market trends strongly in one direction for several months and
then spends many months chopping around without making meaningful progress
in either direction, more often than not the period of 'choppiness' will
be followed by the resumption of the preceding strong trend. This suggests
that the next big move in the T-Bond price will be to the downside.
In summary, we think that 2017 was a year of consolidation for the
T-Bond and that the downward price trend (upward yield trend) that got
underway in Q3-2016 will resume during the first half of 2018.
The Stock Market
The Big Picture
For all intents and purposes, the US stock market's short-term upward
trend extended to year-end. We suspect that this has set the stage for an
early-January downward reversal followed by the first serious decline in
almost two years, but an end to the long-term bull market does not appear
to be imminent. Here's why:
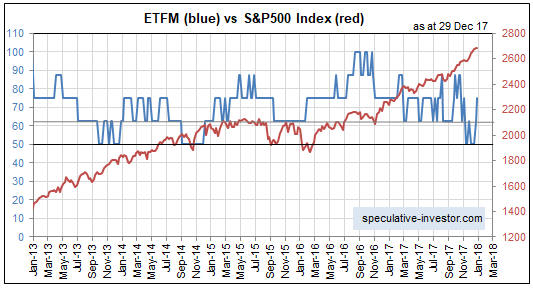
1) It's likely that our Equity True
Fundamentals Model (ETFM) will drop below 50 some months before a major
top in the S&P500 Index (SPX), and at the moment the model is in no danger
of dropping below 50.
2) Debt-based leverage, as indicated by NYSE margin debt, is still on
the rise. It doesn't matter how big a credit bubble becomes, the
proverbial chickens won't start coming home to roost until after
credit/leverage stops expanding.
3) The US yield curve is still in
a flattening trend.
Current Market Situation
Both the SPX and the NDX made their 2017 highs during the week before
last. The subsequent price action suggests the potential for surges to new
highs in early-January, because the late-December declines look more like
consolidations than the beginnings of downward trends.
Here's a
daily chart of the NDX:
At the same time, the EURO STOXX 50 Index (STOX5E) has signaled the
resumption of its downward trend by breaking below support at 3525 on the
final trading day of 2017. Here's the relevant chart:
Also worth mentioning is that our favourite indicator of market
internals has deteriorated over the past two months. The indicator we are
referring to is the difference between the number of individual stocks
making new 12-month highs and the number making new 12-month lows.
For the NASDAQ, the 5-week MA of this difference (the blue line on the
following chart) turned down during the second half of October and
solidified its reversal by crossing below the 15-week MA (the red line)
during the first half of November.
By the way, the put/call indicator that we discussed most recently in
the 13th December Interim Update has not yet generated a sell signal. If
it had we would be more enthusiastic about betting on a sizable short-term
decline.
Here's how we concluded the stock market discussion in
last week's Interim Update:
"With regard to bearish
speculations, our own account contains a position in TSLA put options
expiring in April-2018 and we are looking for an opportunity to add some
April-2018 QQQ put options. For those who prefer to avoid options trading
it could make sense to average into QID (ProShares UltraShort QQQ) over
the next few trading days."
The STOX5E's subsequent downside
breakout increases the probability that the US stock market will soon
embark on a tradable decline, but we have taken no further action. In
other words, we are still looking for an opportunity to add some
April-2018 QQQ (NASDAQ100 Trust) put options. More specifically, we are
interested in buying the QQQ April-2018 $150 puts.
Ideally, the NDX
will surge to a new high this week, creating the opportunity we seek to
get positioned in the aforementioned puts.
This week's
significant US economic events
[Notes:
1) The most important events
(to the markets) are shown
in bold. 2) A list of global economic events can be found
HERE]
| Date | Description |
| Monday Jan-01 | All markets closed for New Year's Day |
| Tuesday Jan-02 | No important events scheduled |
| Wednesday Jan-03 |
Motor Vehicle Sales Construction Spending FOMC Minutes ISM Mfg Index |
| Thursday Jan-04 | No important events scheduled |
| Friday Jan-05 |
Monthly Employment
Report ISM Non-Mfg Index Factory Orders |
Gold and the Dollar
We expect a 1-2 week pullback to no lower than US$1270 followed by the
resumption of the short-term upward trend.
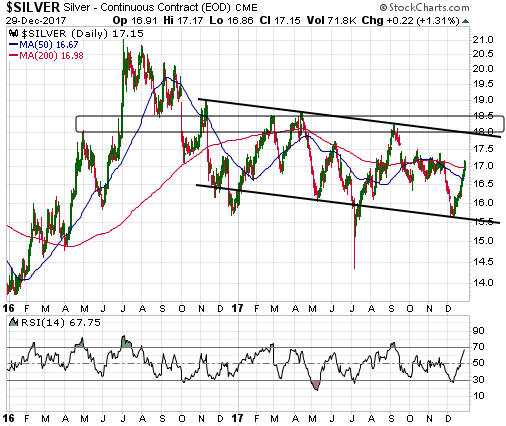
Silver
After remaining stubbornly optimistic about silver's prospects in the
face of neutral or bearish price action from early-September through to
late-November, over the past two weeks speculators have remained
stubbornly pessimistic in the face of a rallying silver price. This is
good if you happen to be long silver-related investments.

The US$ silver price has substantial resistance in the $18.00-$18.50
range. This resistance is shown on the following daily chart. The
supportive sentiment backdrop and the evidence that the US$'s downward
trend has resumed (refer to the currency market discussion below) suggest
that the silver price should at least make it to the aforementioned
resistance prior to a short-term top (a top that holds for more than a
month). In the meantime, a pullback to around $16.50 would be 'buyable'.
Gold Stocks
The top section of the following
daily chart shows that the HUI's rally stopped at the 200-day MA last
week. Importantly, the HUI stayed below its 200-day MA on Friday -- by
ending the day almost dead flat -- despite the gold price breaking above
US$1300.
The bottom section of the chart shows that the HUI/gold
ratio has rebounded since making an 18-month low in early-December, but
that to date the rebound from the December-2017 low has been much weaker
than the rebounds that got underway in January-2016 and December-2016.
In last week's Interim Update we wrote that taking into account the
COT situation, gold's price action and the recent performance of the
HUI/gold ratio, the rally from the December-2017 low looks most similar to
the rally from the July-2017 low. That is still the case. If the
similarity persists then there will be a pullback to the 50-day MA
followed by a 2-3 week surge to a new multi-month high.
At the
moment we have more of a short-term focus than usual. That's by necessity,
because the most likely intermediate-term paths for the gold price and the
gold-mining indices are not clear to us. However, we think that the gold
sector's intermediate-term risk/reward is skewed towards reward, and that,
like gold bullion, the HUI has the potential to test its 2016 high during
the first half of this year.
A more vigorous rally in the HUI/gold
ratio would signal that this potential was going to be realised.
The Currency Market
The
Dollar Index (DX)
US interest rates are substantially higher
than their European equivalents, meaning that the interest-rate
differential strongly favours the US$ over the euro. However, movements in
currency exchange rates are influenced far more by the direction of the
interest-rate differential than by the differential itself. Last week, for
example, there was a sharp rise in Germany's 10-year government bond yield
relative to the equivalent US yield, which boosted the euro against the
US$ and pushed the Dollar Index below important support at 92.5.
Our fundamentals-focused model for the DX is still bullish, but only just.
Due to recent movements in the US-Germany interest-rate differential, the
model's interest-rate component is now close to flipping from US$-bullish
to US$-bearish. If this component does flip it would cause the model
output to shift from US$-bullish (relative to the euro) to neutral.
It's possible that last week's breach of support by the DX will be
reversed this week and thus turn out to be a false signal, but the
breakout should be viewed as genuine/sustainable until proved otherwise.
This is especially so given that last Friday wasn't just the end of a
week, it was also the final trading day of a month and a year.
The
following weekly chart shows last week's downside breakout. There is
important support defined by the September low (91) that should hold if
tested within the next week or so, but the price action suggests that the
DX's downward trend has resumed and that new multi-year lows will be made
during the first quarter of 2018.
A final point worth reiterating is that the COT situation is bearish
for the euro and therefore bullish for the DX. This creates the potential
for a sharp US$ rebound within the coming few weeks, even if the DX is
destined to continue its downward trend for 1-2 more quarters.
The Australian Dollar (A$)
The
major currencies with the most bullish COT situations are the Swiss Franc
(SF), the Japanese Yen and the Australian dollar. In the case of the SF
and the Yen the COT situation has been supportive for about 2 months, but
in the case of the A$ there was a dramatic improvement two weeks ago. This
was discussed in the last week's Interim Update.
The latest report
reveals minimal change in the A$'s COT situation, meaning that the
sentiment backdrop has stayed supportive despite the significant rebound
from the December low. This makes it more likely that the December low was
the final low for the correction that began in early-September.
The
following daily chart shows that the A$ hit resistance at around 78 late
last week. This test of resistance combined with the daily RSI moving into
'overbought' territory may have set the stage for a pullback.
Corrective activity over the next few weeks could lead to new
short-term buying opportunities for both the A$ and the C$. We expect that
both of these 'commodity currencies' will make new multi-year highs during
the first half of 2018, although the exact timing is beyond our ken.
Updates
on Stock Selections
Notes: 1) To review the complete list of current TSI stock selections, logon at
http://www.speculative-investor.com/new/market_logon.asp
and then click on "Stock Selections" in the menu. When at the Stock
Selections page, click on a stock's symbol to bring-up an archive of
our comments on the stock in question. 2) The Small Stock Watch List is
located at http://www.speculative-investor.com/new/smallstockwatch.html
![]() Company
news/developments for the week ending Friday 29th December 2017:
Company
news/developments for the week ending Friday 29th December 2017:
[Note: AISC = All-In Sustaining Cost, FS = Feasibility Study, FY =
Financial Year, IRR = Internal Rate of Return, ISR = In-Situ Recovery,
MD&A = Management Discussion and Analysis, M&I = Measured and Indicated,
NAV = Net Asset Value, NPV(X%) = Net Present Value using a discount rate
of X%, P&P = Proven and Probable, PEA = Preliminary Economic Assessment,
PFS = Pre-Feasibility Study]
*Continental Gold
(CNL.TO) reported the results of its second trial mining program
at the Buritica gold project in Colombia. Like the first trial in
May-2016, it was undertaken to test the validity of the resource model and
the methods that were planned to be used to mine the resource.
The
first trial was a success and yielded approximately double the expected
amount of precious metal. The second trial was also a success and yielded
about 50% more precious metal (49% more gold and 62% more silver) than
predicted.
A risk with a nuggety deposit such as Buritica is that
the amount of gold could be substantially less than predicted by the
resource model. The reason is that it is not economically feasible to
define this type of deposit accurately via drilling. Doing so would
require too many holes and cost too much money. Assumptions are therefore
made in order to create computer models that hopefully reflect what's
below the surface, but these assumptions may not be correct.
The
risk is also an opportunity, though, because it could turn out that the
computer-generated model of the deposit under-estimates the amount of
valuable mineral. Based on the test results of the two bulk samples
extracted by CNL to date, this could well be the case with Buritica.
Anyway, the richness of the deposit won't be known for sure until
after the mine is put into production (2020 or later), and we expect to be
out of the stock before then.
*Euro Sun Mining
(ESM.TO) advised in early-November that the signatory stage of
the mining licence ratification for its Rovina Valley gold-copper project
(Romania) would begin within the coming fortnight. There has been no
further news.
Getting the mining licence ratified has, to date,
taken about 14 months longer than we originally expected, but January-2018
may be the month it finally happens. When it does happen the stock price
should get a significant boost.
The stock price has been in
correction mode for the past 4.5 months (refer to the chart below).
Initial resistance lies at C$1.40.
*Golden Arrow Resources (GRG.V) reported that
the final permit for its proposed Chinchillas mine has been received from
the government of Jujuy Province, Argentina. This means that a minor risk
has been eliminated and that mine construction can now commence. The
processing of ore from Chinchillas is scheduled to begin during the second
half of 2018.
The Pirquitas-Chinchillas project is owned 25% by GRG
and 75% by SSR Mining (formerly called Silver Standard Resources). It is
expected to have average annual production of 6.1 million ounces of
silver, 35 million pounds of lead and 12.3 million pounds of zinc. At
current metal prices this is 9.6M ounces of silver-equivalent, of which
GRG's share would be 2.4M ounces.
GRG's chart (see below) is an
illustration of how quickly the market situation can change for a junior
resource stock. As recently as three weeks ago the GRG stock price was
languishing below C$0.40. It ended last week at C$0.70.
*Nevsun Resources (NSU) appeared to break
upward from a 5-month basing pattern in July, but in early-August the
company announced bad news that caused its stock price to plummet. The
'choppy' basing action then resumed and the chart (see below) now contains
what appears to be a 10-month base. A daily close above US$2.50 will
suggest that the basing period is coming to an end.
NSU is a
reasonable way to gain exposure to zinc and copper.
![]() List
of candidates for new buying
List
of candidates for new buying
From within the ranks of TSI
stock selections the best candidates for new buying at this time, listed
in alphabetical order, are:
1) ALK.AX (last Friday's closing price:
A$0.33)
2) EGD.V (last Friday's closing price: C$0.35)
3)
ESM.TO (last Friday's closing price: C$1.20)
4) NSU (last Friday's
closing price: US$2.44)
5) RSG.AX (last Friday's closing price:
A$1.14)
The above list is limited to five stocks. It will sometimes
contain less than five, but it will never contain more than five
regardless of how many stocks are attractively priced for new buying.
![]() Important
change to the TSI Stocks List
Important
change to the TSI Stocks List
To make the TSI Stocks List
less unwieldy and to thus ensure that we are able to provide adequate
coverage of each listed stock, we are going to impose a limit on the
number of stocks in the List.
Limiting the number of followed
stocks is something that a few other newsletters do to good effect. For
example, John Doody, author of the Gold Stock Analyst (GSA), imposes a
limit of 10. A limit of 10 works for GSA because the letter only deals
with gold and silver stocks, but it would be too restrictive for our
purposes.
We think that 15 is a reasonable maximum for the TSI
List.
It will be a rigid limit, meaning that if there are already
15 stocks in the List then a new stock cannot be added unless an existing
stock is removed. As well as making the List less cumbersome from a
commentary-writing perspective, this will impose some additional
discipline by forcing us to regularly review the risk/reward of all
existing stocks.
We will, however, retain some flexibility in that
the limit will only apply to long-term positions (LIST #1 and LIST #2 on
the stock selections page). In other words, warrants, options and
shorter-term trading positions won't be counted.
There are
presently 19 long-term positions in the TSI List, so we will have to
remove at least four stocks. Two will be removed immediately and at least
two more will be removed by the end of February.
The first of the
two immediate departures is Sprott Resource Holdings (SRHI.TO), which is
being cut from the List because:
1) We aren't satisfied with
management performance to date.
2) The TSI List has, and will
retain, exposure to this company via warrants (SRHI.WT) with an exercise
price of C$0.33 that don't expire until Feb-2022. At their recent price of
C$0.05 the warrants are a little expensive relative to the stock, but if
smart investment decisions by management or (more likely) rising commodity
prices inject substantial value into the stock then the warrants will do
extremely well.
The warrants were received as part of a merger and
entered the TSI List at an initial cost of zero in February-2017, but from
here on we'll assume that the starting price was C$0.05.
SRHI was
down by 6% in 2017 and is also down by 6% since its July-2016 inclusion in
the List.
The other immediate departure is UEX Corp. (UEX.TO), an
exploration-stage uranium company. UEX is being cut because we aren't as
optimistic about the prospects of uranium as we are about the prospects of
several other commodities.
UEX was up by 39% in 2017 but is down by
77% since its March-2011 inclusion in the List.
Chart Sources
Charts appearing in today's commentary
are courtesy of:
http://stockcharts.com/index.html
http://www.goldchartsrus.com/