|
-- Weekly Market Update for the Week Commencing 26th May 2003
Big Picture
View
Here is a summary of our big picture
view of the markets. Note that our short-term views may differ from our
big picture view.
Bond yields (long-term interest
rates) will continue to move in the same direction as the stock market,
that is, new lows in bond yields (new highs in bond prices) will occur
before the end of 2003.
The US stock market will move
well below the October-2002 low during 2003, but a major bottom won't occur
until 2004.
The Dollar commenced a bear
market in July 2001 and will continue its decline during 2003 and 2004.
A bull market in gold stocks
commenced in November 2000 and will continue during 2003 and 2004.
Commodity prices, as represented
by the CRB Index, will rally during 2003 and 2004 with most of the upside
occurring in 2004.
How are
currency exchange rates determined?
A complete answer to the above question
would necessitate a book (one we are not qualified to write). However,
we'd like to just make a couple of points in response to a recent article
by Frank Shostak titled "The Dollar and the Balance of Trade". In this
article, which can be read at http://www.gold-eagle.com/gold_digest_03/shostak052203.html,
Dr Shostak asserts that it is 'purchasing power parity', not the balance
of trade, that determines currency exchange rates. Using a simplistic example,
this means that if 1kg of potatoes can be purchased with 1 US dollar in
the US and 2 euros in Europe then US$1 is equivalent to 2 euros, that is,
the euro/US$ exchange rate should be 2. In this example it would certainly
be possible for the euro/US$ exchange rate to move a considerable distance
from 2 in either direction, but it would eventually move back to purchasing
power parity (2 euros = 1 dollar).
We are in partial agreement with Shostak's
argument because a trade deficit can be thought of as an effect of a mismatch
in purchasing power. In other words, if goods produced in Europe are cheaper
than the equivalent goods in the US then US consumers will buy from Europe
rather than buy the home-grown product. In this case the US would be in
deficit with respect to trade with Europe. However, we think it is important
to take into consideration the fact that trade in goods and services accounts
for less than 10% of total international capital flows, with investment
accounting for the remaining 90+%. So, even if purchasing power parity
exists between the US and the EMU this could only bring approximately 10%
of total capital flows into balance. What happens with the remaining 90%
will be determined by the expectations of investors regarding future 'real'
returns on dollar-denominated investments relative to euro-denominated
investments. As such, if it takes an average of 24 dollars to buy one dollar
of expected future company earnings in the US and 12 euros to buy 1 euro
of expected future company earnings in Europe then the dollar might be
vastly over-priced at a level of 1 euro = 1.17 dollars (the current rate)
even if 1kg of potatoes cost the same in Europe and the US.
At the current exchange rate the US$
and the euro are probably close to achieving purchasing power parity as
far as the prices of goods and services are concerned. As far as investments
are concerned, whether or not purchasing power parity has been achieved
will be determined by what investors expect the real returns in
Europe and the US to be over the next 1-2 years.
Purchasing power parity at an investment
level is not measurable, but the effect of a disparity is observable in
the currency market. For example, the dollar will continue to fall against
the euro if investors are not sufficiently bullish on the US relative to
Europe.
Our view is that the dollar continues
to sport an enormous investment premium - a premium that is evident in
stock and bond market valuations (inflation-adjusted earnings, dividend
and bond yields are very low) - relative to the euro and most other currencies.
This, in turn, implies that the dollar is valued at a level that can only
be sustained if investors throughout the world remain optimistic with regard
to the prospects for US economic growth, earnings growth and interest rates.
The US
Stock Market
The Tax Cut
Below are extracts from a Wall St Journal
article about the tax-cut package that has just been approved by the US
political establishment:
"Congressional leaders' embrace
of a package officially priced at $350 billion over 10 years reflects concerns
that the economy could be slipping back into recession. The true price
tag could as high as $810 billion, if, as expected, various temporary provisions
are ultimately extended. But Mr. Bush is particularly eager to lift the
economy and investors' spirits before he has to face the voters in November
2004. He's looking to avoid the election result his father suffered after
winning a war with Iraq but letting the economy slide."
"Economists believe Ö the tax bill
should add about half of a percentage point to the economy's annual growth
rate in the second half of this year and another half to a full percentage
point next year. That would push the economic growth rate -- barring unhappy
surprises -- to between 3% and 4% over the 18 months."
"White House spokesman Ari Fleischer
said Thursday the tax cut will pump $226 billion into the economy in the
first two years, more than the $191 billion that would have resulted from
the president's initial proposal."
The tax cuts that have just been approved
will need to be financed via more government borrowing. If the new debt
is monetised (purchased by the Fed or by private banks using money created
out of thin air), then this means higher inflation (higher money supply
growth). Using the figures quoted in the Wall St Journal and assuming that
the new debt is monetised (it almost certainly will be), an effect of the
tax cuts is that the money supply has just been given a $350B-$810B boost
(the actual figure will depend on whether or not the temporary provisions
are extended) over the next 10 years. Furthermore, $226B of this increase
in the money supply will occur over the next 2 years.
If the new debt is not monetised then
the tax cuts will simply result in a few hundred billion dollars being
transferred from one group of people (the people who buy the new debt)
to another group (the beneficiaries of the tax cut).
Either way there will be no sustainable
increase in real economic growth (sustainable growth must be based on savings,
not on debt). However, it is likely that GDP growth will be given a boost
over the next 12-18 months (growth will be higher than it would have been,
although it still probably won't be very high).
In our opinion, the tax cuts represent
a slight positive for the overall stock market over the next year or so
and a very significant positive for commodity prices (including the gold
price). This, in turn, will likely mean that if the stock market can hold
above support during the current pullback (see below) then the ensuing
rally should result in substantial out-performance by the commodity-cyclical
stocks. As such, if we see some evidence that support is going to hold
then we'll probably add one or two more non-gold commodity stocks to the
TSI Stocks List.
Current Market Situation
A pullback has been underway in the
stock market over the past couple of weeks. There was an initial drop and,
as almost always happens, a partial retracement of the initial drop. If
the market continues to follow a normal corrective pattern then the next
stage of the decline should commence in the near future (this week).
As the pullback progresses we will
be watching a number of indicators to help us determine whether it represents
the first stage of a major decline (one that will eventually result in
last October's lows being decisively breached) or simply a correction within
an on-going rally. Our guess is that it will turn out to be the latter
and that a major decline won't begin until at least the third quarter of
this year, but fortunately we don't have to rely on guesses.
We've mentioned in previous commentaries
that the performance of the NASDAQ100 Index relative to the performance
of the Dow Industrials Index will help us figure out whether the current
pullback is a normal correction or something far more significant. Some
examples of other things we'll be monitoring are:
1. The Walmart (WMT) stock price. WMT
has been a leading indicator for the overall market during the past year.
For example, WMT peaked about 6 weeks before the overall market during
the final quarter of last year and bottomed about 5 weeks before the overall
market during the first quarter of this year.
As the below chart shows, WMT peaked
at the end of April and has recently been very weak. It has reached support
in the 51.50-52.00 range and will probably soon bounce, but if the next
rally in WMT makes a lower high (below the April high) and the stock subsequently
makes a lower low then the overall market is most likely in big trouble.

2. The semiconductor stocks, as represented
by the Semiconductor Index (SOX), failed to confirm the recent moves to
new recovery highs by the NASDAQ100 Index and the NASDAQ Composite Index.
It would now be a bearish sign for the overall market if the SOX closes
below the uptrend-line shown on the below chart.

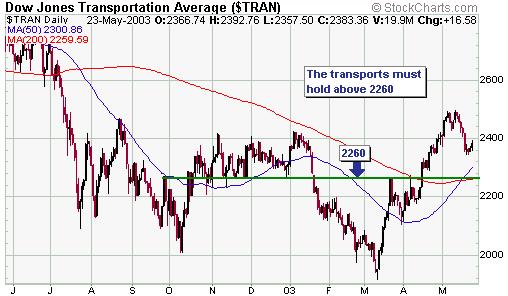
3. The Dow Transportation Index has
been one of the best-performing stock indices over the past 2 months. If
the 'transports' can hold above support at 2260 during this pullback then
we are probably seeing a correction within an on-going rally rather than
the start of a major decline.
The SARS Threat
Current indications are that the impact
of SARS on the economies and stock markets of the world is not going to
be as great as appeared likely just one month ago. Although new cases and
deaths are still occurring, the rate at which the disease is spreading
has slowed dramatically over the past few weeks and the WHO has just removed
its travel warning from Hong Kong. SARS still represents a risk, but it
appears as though the disease has been contained.
This week's important economic/market
events
| Date |
Description |
| Monday May 26 |
No significant events |
| Tuesday May 27 |
Consumer Confidence
Existing Home Sales
New Home Sales |
| Wednesday May 28 |
Durable Goods Orders |
| Thursday May 29 |
No significant events |
| Friday May 30 |
Personal Income and Expenditure |
 Click
here to read the rest of today's commentary Click
here to read the rest of today's commentary

|
