![]()
![]()
![]()
![]()
12-Month Forecast, Updated 30th November 2020
Our previous 12-month forecast update was three months ago. Although a
lot has happened in the world and financial markets since then, our
intermediate-term views are pretty much unchanged.
What transpires in the major financial
markets over the coming 12 months hinges to a large extent on what happens
to "inflation"* and the US dollar's exchange rate, which are, themselves,
inter-related (what happens to the US$ has a big influence on what happens
to "inflation", and vice versa). This is often the case, by the way, in
that if you are right about the US$ and "inflation" you stand a good
chance of being right about the stock, bond, gold and commodity markets.
Regarding "inflation", our 12-month
lookahead is unchanged since the start of this year. In January we wrote
that the next 12 months would involve a substantial (by the standards of
the past 10 years) increase in what most people think of as "inflation".
Obviously there was a huge detour during March-April as the developed
world experienced the most intense deflation scare ever thanks to
government-imposed economic shut-downs in reaction to the COVID-19
pandemic. However, the monetary and fiscal responses to the debilitating
effects of the shut-downs combined with the semi-permanent damage to the
production structure should ensure that "inflation" indicators such as the
US CPI are at 10-year highs by the second quarter of 2021. This prediction
is unchanged from our previous update.
In effect, policymakers have taken
actions that simultaneously will limit supply and bring about a large
increase in monetary demand. The idea that this will lead to much higher
prices for many things should not be controversial.
The following excerpt from our
previous 12-month forecast update (in July-2020) remains applicable:
"The
idea of a Q1-2020 detour followed by a steeper move in the direction
originally envisaged applies almost across the board to the markets we
track. For example, in January we forecast that the Dollar Index (DX)
would trend downward over the ensuing 12 months as the US stock market
became a relative laggard and as 'capital' shifted towards the economies
that provided the most leverage to commodity production, and that the
Australian dollar (A$) would be the strongest of the major currencies. The
"coronacrisis" prompted a scramble for US dollars during the first half of
March that led to a rapid rise in the DX and a crash in the A$, but since
the third week of March the DX has trended downward and the A$ has been
the world's strongest major currency by a wide margin."
Since we wrote the above, evidence has
emerged to support our view that the US stock market will become a
relative laggard. As illustrated by the following weekly chart, the S&P500
ETF (SPY) peaked relative to the iShares MSCI Eurozone ETF (EZU) in
early-May and made a lower high in October. A lower low would confirm the
trend shift in relative strength.

With regard to expected performance
over the coming 12 months we remain bullish on the A$ and bearish on the
DX, although we acknowledge the risk of significant countertrend moves
over the coming 2 months.
Also still applicable are the
following comments regarding commodities:
"...in
January we wrote that the monetary inflation rebound promoted by central
banks would boost the prices of industrial commodities such as oil and
copper to a far greater extent than it boosted economic growth and overall
corporate profitability. This is starting to become evident. It's likely
that oil and the stocks of oil producers will perform worse over the
course of 2020 than we expected in January, but industrial metals and the
associated equities look set to do as well as originally expected.
Furthermore, oil should return to its January-2020 high (near $60) or
higher by the second quarter of next year."
The oil sector was comparatively slow
to rebound from the major economic dislocation that occurred during
March-April, but it has started to play catch-up and looks set to
outperform over the bulk of the coming 12 months. However, it should be
kept in mind that the nascent oil-stock rally is part of a much bigger
story. Specifically, we are witnessing a cyclical rise in commodity prices
driven by monetary and fiscal profligacy combined with government-imposed
production obstacles and extreme relative under-valuation.
Regarding the US stock market, in our
previous 12-month forecast update we wrote that we expected the SPX to
exceed its early-2020 all-time high during the first half of next year if
not sooner, but that the new high would be solely the result of US$
depreciation. In other words, it looked to us like the US stock market's
'real' bull market top was in the past. We will stick with that assessment
for now.
As an aside, if you sell short and the
price goes up you will lose money regardless of whether the price gain is
'real' or solely the result of currency depreciation. In general, it isn't
a good idea to be short the stock market at a time when central banks and
governments are throwing huge amounts of money around, although individual
stock shorts could still work.
Our outlook for the US economy has
been essentially unchanged over the past six months. We are expecting the
economic rebound that got underway during May-June of this year to peak by
the middle of next year at well below the January-2020 level and for the
US economy to be back in official recession territory by the first half of
2022.
Turning to the bond market, again
there's no change in our 12-month outlook. We expect that bond yields will
rise over the coming 12 months and that the yield curve will continue its
steepening trend (in response to rising inflation expectations), but that
the magnitudes of both moves will be less than they 'should' be due the
actions of the Fed and other central banks.
We expect that gold will resume its
long-term upward trend in US$ terms by early next year, but we think that
it made a multi-year peak in A$ terms and relative to the S&P Spot
Commodity Index (GNX) during March-April of this year. Due to the
sentiment boost it will get from new highs in the US$ gold price, the gold
mining sector should perform well next year.
Summing up, we continue to expect that
the price trends that were set in motion between mid-March and mid-April
of this year will extend well into next year. This means that we are
looking for continued weakness in the US$ and strength in the commodity
currencies, across-the-board strength in commodity prices, strength in
gold in US$ terms but not in terms of industrial metals or the GNX,
strength in non-US equities relative to US equities, and strength in the
gold mining sector of the stock market.
*There
are many ways to define inflation. We put quotation marks around the word
to indicate that in this case we are using the popular/mainstream
definition -- an increase in the general price level as measured by the
CPI.
12 Month Forecast,
updated 29th July 2020
We published a 12-month forecast on 20th January, 2020. Due to government
decisions to lock down large parts of many economies in response to a flu
virus, this forecast was overwhelmed by events over the ensuing two
months. We therefore did a forecast update on 15th April, but at that time
there were too many unknowns to be specific.
Probably the most
important part of our January-2020 forecast was our outlook for
"inflation", the reason being that most of our market views hinged off our
"inflation" view. In January we wrote that the next 12 months would
involve a substantial (by the standards of the past 10 years) increase in
what most people think of as "inflation". In April we didn't change our
"inflation" forecast, but an adjustment was appropriate.
We
explained the adjustment using a metaphor. We wrote: "Originally, we
were going to take a flight from Singapore to northern California. Now, we
will be flying from Singapore to Alaska, but we will be getting there via
New Zealand." In other words, there was going to be even more
"inflation" than originally envisaged -- after a big move in the opposite
direction.
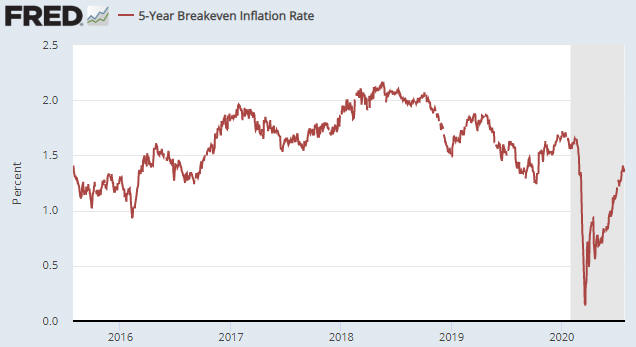
By way of additional explanation, here is a chart that
shows the "5 year breakeven inflation rate". In effect, this chart shows
the expected (by the market) yearly rate of CPI growth over the next few
years. This year started at around 1.7%, after which there was a plunge to
around 0.2% and then an upward move to around 1.4%. We think that the
post-March-2020 upward trend is destined to continue over at least the
next 12 months.
Our reason for expecting much higher "price inflation" was/is not only
the tremendous size of the monetary response to the economic damage caused
by the lockdowns, but also the way the new money was/is being distributed.
Of particular relevance, unlike the previous bouts of Quantitative Easing
that were totally focused on pumping money into the financial markets,
this time around a lot of new money has been and will continue to be
provided directly to businesses and individuals. This should ensure that
the 'problematic' inflationary effects (the effects on the prices of
everyday goods and services, as opposed to the prices of assets) of the
2020 money pumping will be much greater.
In the April update we
summed up our adjusted "inflation" outlook by writing: "...the stage
is being set for a veritable tidal wave of new money to meet a reduced
supply of goods and services. This WON'T result in hyperinflation in the
US or other developed economies in the foreseeable future (say, the next
two years), but it very likely will result in much higher levels of "price
inflation" within 12 months of the passing of the immediate COVID-19
crisis."
We don't have to make another adjustment, but it is
now possible to be more specific. The immediate COVID-19 crisis ended in
May-June, so our expectation is that the US (many other countries too, but
the problem will be bigger in the US due to that country's
disproportionately-large increase in government spending) will be
experiencing the highest rate of "price inflation" in more than 10 years
by Q2-2021.
The idea of a Q1-2020 detour followed by a steeper move
in the direction originally envisaged applies almost across the board to
the markets we track. For example, in January we forecast that the Dollar
Index (DX) would trend downward over the ensuing 12 months as the US stock
market became a relative laggard and as 'capital' shifted towards the
economies that provided the most leverage to commodity production, and
that the Australian dollar (A$) would be the strongest of the major
currencies. The "coronacrisis" prompted a scramble for US dollars during
the first half of March that led to a rapid rise in the DX and a crash in
the A$, but since the third week of March the DX has trended downward and
the A$ has been the world's strongest major currency by a wide margin.
For another example, in January we wrote that the monetary inflation
rebound promoted by central banks would boost the prices of industrial
commodities such as oil and copper to a far greater extent than it boosted
economic growth and overall corporate profitability. This is starting to
become evident. It's likely that oil and the stocks of oil producers will
perform worse over the course of 2020 than we expected in January, but
industrial metals and the associated equities look set to do as well as
originally expected. Furthermore, oil should return to its January-2020
high (near $60) or higher by the second quarter of next year.
Regarding the US stock market, in January we wrote:
"The
long-term US equity bull market won't end in 2020, but the January-2020
high for the S&P500 Index (SPX) will be close to its high for the year.
More specifically, we expect a sizable correction from a January high
followed by a rally that makes only a marginal new high (at best) before
the next sizable correction gets underway. In this regard, 2020 will have
a lot more in common with 2018 than with 2017 or 2019."
We
ended up getting a crash rather than just a "sizable correction", but the
SPX actually has followed the expected pattern and probably will continue
to do so. However, it's certainly possible that for all intents and
purposes the long-term equity bull market ended in the first quarter of
this year.
We say "for all intents and purposes" because we think
that the SPX will exceed its early-2020 all-time high during the first
half of next year if not sooner, but that the new high will be solely the
result of US$ depreciation. In other words, it looks like the US stock
market's 'real' bull market top is behind us.
Regarding the US
economy, although coming into this year the message from our favourite
leading indicators was that a recession would begin during the first half
of 2020, we guessed in January that there would be sufficient monetary
inflation to postpone the start of a recession until 2021. The lockdowns
invalidated this guess.
Both the monetary and fiscal responses to
the lockdown-related economic collapse should ensure that there won't be
anything like a complete recovery from the H1-2020 recession for many
years. As explained over the past couple of months, we are expecting the
economic rebound that got underway during May-June of this year to peak
during the first half of next year at well below the January-2020 level
and for the US economy to be back in official recession territory by the
first half of 2022.
Regarding the bond market, in January of this
year we thought that yields would move higher during 2020, but not
substantially so, and that the US yield curve would steepen. The US yield
curve has steepened significantly since early this year, but thanks to the
economic lockdowns the US T-Bond yield made a new all-time low in
March-2020 and has since chopped around near its low. We expect that bond
yields will rise over the coming 12 months and that the yield curve will
continue its steepening trend, but that the magnitudes of both moves will
be less than they 'should' be due the actions of the Fed.
In
general, we expect the price trends that were set in motion between
mid-March and mid-April of this year to continue until at least the second
quarter of next year. This means that with regard to the next 9-12 months
we are looking for continued weakness in the US$ and strength in the
commodity currencies, across-the-board strength in commodity prices,
strength in gold in US$ terms but not in terms of industrial metals or the
S&P Spot Commodity Index (GNX), strength in non-US equities relative to US
equities, and strength in the gold mining sector of the stock market.
As always there will be corrections along the way, with the period
between now and the early-November US election being a likely time-window
for significant countertrend moves.
12 Month Forecast,
updated 15th April 2020
Due to the dramatic events of Q1-2020, the main ones being the
economy-wide shutdowns, the stock market crash that resulted from the
shutdowns, and the massive central bank buying spree prompted by
collapsing asset prices and sky-rocketing job loss numbers, an update to
our 12-month forecast seems appropriate.
Unfortunately, there is so
much uncertainty right now that drawing conclusions about what the future
holds in store is far more difficult than usual. In particular, a great
deal hinges on the timing of a general return to work, which at the moment
is unknown. For example, there's a huge difference for both the financial
markets and the economy between a May-June return to work and an
August-September return to work. Therefore, while we know that our
previous forecast (dated 15th January 2020) has been largely overridden by
events, at this time we simply don't have enough information to do a
comprehensive update.
What we can do right now is address a few
parts of our previous forecast that definitely are not going to happen or
will happen in a very different way, beginning with our forecast that the
next 12 months will involve a substantial (by the standards of the past 10
years) increase in what most people think of as "inflation".
The
two overarching contributors to "price inflation" are the change in the
supply of goods/services and the change in the monetary demand for
goods/services. Thanks to the lockdowns, both sides of this supply-demand
equation have plummeted over the past several weeks. Furthermore, with
regard to big-ticket and discretionary items, demand has fallen much
faster than supply. This should lead to large short-term declines in some
of these prices.
Now, we get the impression that most
policy-makers and commentators are labouring under the assumption that the
economy can be shut down for a few months and then restarted, such that
within a short time almost everything is back to the way it was prior to
the shut-down. However, the economy doesn't work that way. Many businesses
will never be able to restart, many supply chains will be permanently
broken and many jobs will be lost forever. Consequently, the supply side
has suffered a hit that probably will take years to recover from, even if
government restrictions start being lifted within the next few weeks and a
general return to work occurs before mid-year.
The supply side also
will be hurt in the long-term by the massive amount of money that is being
thrown around by governments and central banks in an effort to reduce the
short-term pain. The reality is that governments and central banks do not
have wealth reservoirs that can be drawn upon in times of crisis. All they
can do is redistribute existing wealth and incentivise capital consumption
('eating of the seed corn'). This will ensure that the economy is not as
productive post-crisis as it was pre-crisis.
At the same time, the
new money that is being injected into the economy will give the monetary
demand for goods/services a substantial boost AFTER the immediate crisis
has passed. Note that unlike the Quantitative Easing of 2008-2014, which
involved pumping money into the financial markets, this time around a lot
of new money will be provided directly to businesses and individuals. This
means that the inflationary effects of the current money-creation schemes
will be more apparent in everyday prices than was the case with earlier
schemes.
In summary, the stage is being set for a veritable tidal
wave of new money to meet a reduced supply of goods and services. This
WON'T result in hyperinflation in the US or other developed economies in
the foreseeable future (say, the next two years), but it very likely will
result in much higher levels of "price inflation" within 12 months of the
passing of the immediate COVID-19 crisis.
We can use an analogy to
explain the change to our "inflation" forecast. Originally, we were going
to take a flight from Singapore to northern California. Now, we will be
flying from Singapore to Alaska, but we will be getting there via New
Zealand.
Another part of our previous forecast that can be updated
immediately has to do with recession. Even though our leading indicators
were suggesting that a US recession would begin during H1-2020, at the
beginning of this year we guessed that the US economy would be stagnant
during 2020 and that the strong rebound in monetary inflation throughout
the developed world over the preceding six months would postpone the start
of a global recession until 2021. Due to the widespread lockdowns there is
no doubt that a global recession began in March of 2020, but there isn't
yet enough information to speculate about when the recession will end.
We also can be fairly certain that our previous forecasts regarding
oil and the oil sector will be wrong. In some industrial commodity markets
the lockdown-related supply reductions could, within a few months,
counteract the lockdown-related demand reductions, enabling prices to make
new 12-month highs by the end of this year in response to the coming
increase in monetary demand. The oil market is a different story, though.
Unless war breaks out in the Middle East, an abundance of supply probably
will weigh heavily on the price for the bulk of this year, preventing
anything more bullish than a rebound to the $40s. The low oil price
should, however, eventually take a significant toll on oil supply,
potentially paving the way for a substantial price rise during 2021.
We plan to do our next 12-month forecast update in July. Hopefully by
then the virus-related lockdowns will be over, thus removing a huge source
of uncertainty and enabling us to be more specific about all the markets
we follow.
12 Month Forecast,
updated 20th January 2020
1) The next 12 months will involve a substantial (by the standards of the
past 10 years) increase in what most people think of as "inflation".
Central bank money-pumping, commercial bank money creation, the general
belief that central banks have gone too far in their efforts to promote
"inflation" and an increase in the use of fiscal stimulus leading to
accelerated growth in government indebtedness will contribute to the loss
of money purchasing power. The key, however, will be the spreading
realisation that central banks have begun to act with the express purpose
of monetising government deficits.
2) Rising inflation expectations will lead to an
upward trend in government bond yields (a downward trend in government
bond prices) throughout the developed world, but a major rise in interest
rates won't happen in 2020. The start of a major rise in interest rates
will wait until after the next global recession.
3) Due in part to the general realisation that the
experiment with negative interest rates has been a total failure, the ECB
will come under irresistible political pressure to end this experiment.
Consequently, bond yields will rise further (bond prices will fall
further) in Europe than in the US.
4) When the global quantity of negative-yielding
debt soared to around US$17T in August-2019 we wrote that this was a type
of bubble peak and that the quantity of such debt would reduce to zero
within two years. Due largely to rising interest rates in Europe, this
forecast will come to fruition in 2020.
5) Rising inflation expectations will put upward
pressure on long-term interest rates relative to short-term interest
rates, causing the US yield curve to steepen. The steepening of the yield
curve will be assisted by the Fed keeping its boot on interest rates at
the short end of the curve.
6) Due to a strong rebound in monetary inflation
throughout the developed world over the past six months and signs that
China's central planners have begun to loosen the monetary reins, a global
recession won't begin until 2021. However, the US tariffs on Chinese
imports will continue to weigh on US economic growth and election-related
uncertainty will become a significant economic depressant at some point,
resulting in a nearly-stagnant US economy during 2020.
7) The monetary inflation
rebound promoted by central banks will boost the prices of industrial
commodities such as oil and copper to a far greater extent than it boosts
economic growth and overall corporate profitability. Oil also will get
boosted during the second half of the year by heightened geopolitical
tensions in the Middle East and the resultant threat of a supply shock.
Consequently, oil will be the US stock market's best-performing major
sector by a wide margin.
8)
Due largely to rising long-term interest rates and a steepening yield
curve, US bank stocks will perform better than the broad market. However,
thanks in part to the large gains that were made by these stocks during
the final four months of 2019, absolute returns won't be impressive.
9) In response to the scaling back and eventual
removal of the ECB's destructive negative interest rate policy (NIRP),
euro-zone bank stocks will perform substantially better than their US
counterparts.
10) Non-US
equities in general and European equities in particular will do better
than US equities as the combination of high average valuation and slow (or
no) earnings growth finally begins to weigh on the US stock market.
11) The Dollar Index will trend downward as the US
stock market becomes a relative laggard and as 'capital' shifts towards
the economies that provide the most leverage to commodity production. The
Australian dollar will be the strongest of the major currencies.
12) The long-term US equity bull market won't end
in 2020, but the January-2020 high for the S&P500 Index (SPX) will be
close to its high for the year. More specifically, we expect a sizable
correction from a January high followed by a rally that makes only a
marginal new high (at best) before the next sizable correction gets
underway. In this regard, 2020 will have a lot more in common with 2018
than with 2017 or 2019.
13)
Despite a lacklustre economy and stock market, Donald Trump will be
re-elected in November-2020 thanks mainly to the lack of a viable
alternative. However, the stock market's celebration will be short-lived
due to the massive protests that will erupt during the weeks following the
election.
14) The US$ gold
price will make a 12-month high during the first quarter of 2020.
Thereafter it will move in a wide range, with the effects of its relative
expensiveness and precarious sentiment situation being offset by
supportive fundamentals stemming from economic and political uncertainty.
15) Silver will outperform gold, but copper and
zinc will outperform silver. As a result, base-metal mining stocks
generally will do better than gold or silver mining stocks.
16) The Fed will be like a deer in the headlights.
It will be concerned about rising "inflation", but it will be dissuaded
from rate-hiking by stock market volatility and generally lacklustre
economic data. However, in a 'hat tip' to the evidence of increasing
"inflation" the Fed will end its balance-sheet expansion by April-2020.
As an aside, there is a largely-irrelevant debate
happening in the world of market commentators as to whether the Fed's
latest asset monetisation program is Quantitative Easing (QE). The Fed
claims that it is not QE because the program was not introduced with the
aim of easing monetary policy and stimulating the economy, and some
analysts agree. However, the Fed's reason for implementing a policy does
not determine the nature of the policy. The Fed's provision of 'liquidity'
to the "repo" market involves very short-term loans and therefore is not
QE, but the $60B/month asset monetisation program introduced by the Fed in
mid-October of last year has exactly the same effects on bank reserves and
the money supply as the QE programs of 2008-2014. Regardless of the Fed's
stated or actual motivation, the program eases monetary conditions by
increasing the quantity of money. It is, by definition, quantitative
easing. That's a fact.
17)
The periodic stock market swoons will not help the Treasury market,
because government bonds will stop being perceived as safe havens.
18) Due to the combination of adverse changes in
climate (the changes aren't caused by humans, but that's a separate
issue), reduced international trade as regions become increasingly
isolationist and the higher cost of bulk commodity shipping due to
IMO 2020, the prices of many agricultural commodities will commence
major upward trends. This will lead to much higher stock prices for
fertiliser producers such as Nutrien (NTR) and Mosaic (MOS).
In addition to the intermediate-term expectations
outlined above, here are some big themes that extend well beyond the next
12 months but still could influence our positioning over the year ahead:
1) The rising interest-rate trend
This is a new secular trend that will evolve into
one of the biggest stories of the 2020s.
2) A paradigm shift in road transportation
Road transportation will be revolutionised in two
ways: Electric Vehicles (EVs) will proliferate during the first half of
the 2020s and during the second half of the 2020s there will be a major
shift away from car ownership due to the combination of automation
(self-driving vehicles) and ride sharing.
A related issue is that most analysts are
forecasting steady growth in EV production, but that's not the way
important new technologies are adopted. Instead, the rate of adoption
tends to follow the
Innovation
S-Curve.
In the bottom
part of the "S", growth is significant but the new technology is yet to
make major inroads. At some point a critical mass of usage is achieved and
the growth becomes explosive. In seemingly no time the technology goes
from being used by a relatively small group of early adopters to being
used by almost everyone. The television, the microwave oven, the personal
computer, the internet and the smart phone all went through "S curves". We
expect that it will be the same story for EVs.
EV usage currently is in the bottom part of the
"S". The big unknown is when the middle part of the "S" will begin. We
doubt that it will begin this year, but it could begin during 2021-2022.
Because most analysts are
not factoring the "Innovation S Curve" into their EV production forecasts,
most current estimates of future demand for the commodities used in the
manufacture of EV batteries and motors will prove to be far too low. A
likely consequence will be much higher prices for battery metals
(primarily lithium, nickel and cobalt at this time) and the rare earth
metals used to make the permanent magnets that go into electric motors.
3) The end of the age of real estate
It will still be possible to achieve good returns
by investing in real estate, but gone are the days when anyone could buy a
house almost anywhere and likely end up with a substantial profit as long
as they held for 10 years or more. From now on only astute investors will
consistently make good returns from real estate, where "astute" means able
to time the cyclical swings in the broad market or able to correctly
anticipate future supply-demand imbalances in specific areas.
For the average person, residential property will
transition from an investment to what it was prior to the 1970s: a
consumer good (something bought solely for its use value).
There are two reasons for the change, the first
being the interest-rate trend. The 3-4 decade downward trend in interest
rates resulted in a 3-4 decade upward trend in housing affordability for
buyers using debt-based leverage (that is, for the vast majority of
buyers). There were corrections along the way, but provided that long-term
interest rates continued to make lower lows there eventually would be a
pool of new debt-financed buyers able to pay a much higher price.
There's a good chance that the secular
interest-rate trend reversed from down to up during 2016-2018. If so,
future house buyers that don't have good timing and/or substantial
area-specific knowledge generally won't make long-term capital gains on
their residential property purchases.
The second reason for the change involves the
availability of credit. Over the past 50 years it became increasingly easy
for the average person to borrow a lot of money using his/her house as
collateral, because the overarching trend was for banks to leverage-up
their balance sheets. However, the high levels of existing indebtedness
and restrictions on the extent to which banks can leverage themselves
probably mean that it will become progressively more difficult to qualify
for a home mortgage.
4)
Under-investment in fossil fuels
Due to political correctness gone mad, many large
investors will steer clear of opportunities in the oil, gas and coal
industries. This will lead to higher energy costs and slower economic
growth than otherwise would be the case.