![]()
![]()
![]()
![]()
2016 Yearly
Forecast
 The US Stock Market
Here's part of last year's
stock-market forecast:
"Because monetary conditions remain very easy, the sort of stock market
collapse that occurred in 2008 is not a realistic possibility for 2015. A down
year for the US stock market is very likely, though.
Our best guess at this time (guess is another word for forecast) is that what we
had in mind for 2014 will happen in 2015. In particular, we expect the high for
the year to occur within the first few months (it's possibly already in place),
after which the market will gradually roll over to the downside. A choppy
decline that leaves the S&P500 with a loss of around 10% by year-end 2015 is far
more likely than a crash, with greater downside in store for next year [2016] if
the start of a bear market is signaled this year."
Our 2015 forecast was roughly correct in that the S&P500 (SPX) peaked in May and
then gradually rolled over to the downside, although as usual we were too
bearish (the SPX ended the year with a loss of only 1%). Also worth mentioning
is that we made a more specific forecast around mid-year that proved to be quite
accurate. The mid-year forecast was for a 10%-20% decline from a July peak to a
low by early-October.
With a bear market having been signaled -- albeit not confirmed -- by the price
action of the past 6 months, there is scope for greater downside in 2016. This
is already evident from what has happened during the first two weeks of the
year.
Monetary conditions remain very easy, so the sort of stock market collapse that
occurred in 2008 is still not a realistic possibility. However, we think that
the SPX will experience a peak-to-trough decline of more than 20% during the
year. Just to be clear, if the 4th January intra-day high of 2038 turns out to
be the high for the year, then our forecast is for the SPX to trade below 1630
at some point during the year. Also, we expect that the SPX will end the year
with a loss of more than 10%, which means that we expect the SPX to end the year
below 1840.
What will be the main driver of stock-market weakness in 2016?
Over history there hasn't been a strong relationship between economic growth and
stock-market performance, but this year we expect that evidence of economic
weakness will weigh heavily on equity prices. The reason is that equity
valuations have been boosted over the past two years by the widespread belief
that a period of strong economic -- and therefore earnings -- growth will soon
begin. Once this stubborn belief begins to crumble, a critical support will be
kicked out from under the stock market.
The US Dollar
Our 2015 Yearly Forecast was for the Dollar Index to have a downward
bias during the first half of the year due primarily to weakness in US equities
relative to European equities. At the time of writing our 2015 forecast we had
no opinion on what would likely happen to the currency market during the second
half of the year.
We got the expected relative strength in European equities during the first half
of last year, but there was a huge overshoot to the downside in the euro and a
corresponding overshoot to the upside in the Dollar Index during the first 2.5
months as the currency market seemed to discount the ECB's QE program multiple
times. These overshoots were then retraced, leaving the Dollar Index and the
euro with only small net changes over the course of the year's first 6 months.
Due to its dramatic rise during the first 2.5 months of the year, by March-2015
the Dollar Index was as stretched to the upside as it had been at the major top
in 1985. This made it distinctly possible that a long-term top was put in place
at that time. However, the subsequent price action looks far more like an
intermediate-term consolidation than the first stage of a new cyclical bear
market. Moreover, the Dollar Index will probably be supported this year by
economic problems, social upheaval linked to the mass migration of people from
the Middle East, political instability and relentless central-bank idiocy in the
euro-zone. Another multi-month upward leg in the Dollar Index's cyclical bull
market is therefore likely prior to a final top.
Further to the above, we expect the Dollar Index to trade at least a few points
above its March-2015 peak sometime this year. We don't have a firm opinion on
whether this will happen during the first half or the second half of the year,
but if forced to make a guess we'd say the second half.
The Dollar Index is effectively the reciprocal of the euro, so the above
paragraph means that we expect the euro to trade at new bear-market lows before
bottoming on a long-term basis. With regard to other currencies, as noted in the
list of 2016 surprises presented early this month we expect the Yen to be this
year's strongest major currency. Also, we expect that the A$ and the C$ will
reach intermediate-term bottoms along with the commodity indices during the
first quarter of the year.
T-Bonds
We expected
2015 to be a flat year for long-dated US Treasury Bonds and Notes. It wasn't an
exciting forecast, but it turned out to be close to the mark.
For this year, we expect the prices of long-dated US Treasury Bonds -- as well
as the long-dated bonds issued by the governments of Japan and Germany -- to
top-out during the first quarter and to have a downward bias thereafter. Also,
we expect that the price highs reached during the first quarter will be below
last year's highs.
As stated in the list of potential 2016 surprises included in the 11th January
Weekly Update, the post-Q1 downward bias in T-Bonds is expected to be driven by
a choppy post-Q1 recovery in commodity prices, a gradually-emerging concern that
many years of monetary profligacy will lead to an "inflation" problem, the
reasonable expectation that governments will apply the same old Keynesian
'remedies' in response to mounting evidence of recession, and a continuing
decline in China's foreign currency reserves (the reserves are held in the form
of government bonds).
With regard to price targets, we refer to the following monthly chart. This
chart shows the T-Bond's long-term channel and 84-month MA.
Our price expectations are based on the fact that every intermediate-term T-Bond
decline since 1990 has ended at or slightly below the 84-month MA. They are also
based on the fact that whenever the T-Bond has been as extended to the upside as
it was in early-2015, the subsequent downward trends didn't end until the price
had reached the channel bottom and/or the 84-month MA.
We therefore expect that the T-Bond price will fall at least as far as its
84-month MA before bottoming on an intermediate-term basis. It could fall a lot
further, although we suspect that a major decline in the US government bond
market will be one of the next decade's big stories.

Gold
and the Gold Mining Indices
In our 2015 Yearly Forecast, we wrote:
"There is never a good time to make a 12-month forecast, since forecasting is
for the birds. But right now [January-2015] is a particularly bad time to make a
gold forecast, the reason being that changes in other markets are needed to turn
the gold market higher on a sustained basis and the needed changes may or may
not be about to happen. Of primary importance, a sustained turn to the upside in
gold almost certainly requires a sustained turn to the downside in US equities.
Some long-term indicators are warning that such a change is in the works, but
the S&P500's price action hasn't yet signaled anything of the sort."
We went on to guess that if the S&P500 made some additional headway over the
ensuing few months then gold would drop to test its 2014 bottom during the
second quarter of the year prior to a long-term reversal.
A long-term reversal obviously didn't happen last year, in that gold broke below
its 2014 bottom and made new bear-market lows in July and December. However,
although the final doubt-removing piece of the puzzle (a weekly S&P500 close
below the August-2015 low) hasn't yet fallen into place, we now have persuasive
evidence that a US equity bear market is underway. If this evidence is sending
the right message then the fundamental backdrop is about to become a lot more
gold-bullish and the US$ gold price is close to a major turning point in terms
of both price and time.
The bear-market bottom to date for the US$ gold price was $1045 last December.
The price dropped into the $1040s twice -- in early-December and again at around
the time of the Fed's first (and possibly only) rate hike in mid-December. This
could turn out to be the final bear-market bottom, although the recent relative
weakness in the gold-mining sector and the on-going steep declines in some
high-profile industrial commodities mean that we shouldn't be surprised if the
gold price undercuts its December low in the first quarter of this year before
making a sustained turn to the upside.
We expect that there will be a sustained turn to the upside from a Q1-2016 low,
but that the upward trend over the remainder of the year will be choppy and that
gold will end the year with a net gain of 'only' 10% (or thereabouts). This
would be similar to what happened in 2000-2001, which appears to be the best
analog to the present situation.
After the US$ gold price turns upward, the gains achieved by the gold-mining
indices are likely to greatly outstrip the gains achieved by gold. This is
consistent with what happened in the past and with the dramatic relative
weakness of the gold-mining indices over the past few years.
We expect that the HUI will gain at least 50% within two months of a major
Q1-2016 bottom and end the year at least 100% above whatever low it makes during
the first quarter.
Industrial Commodities
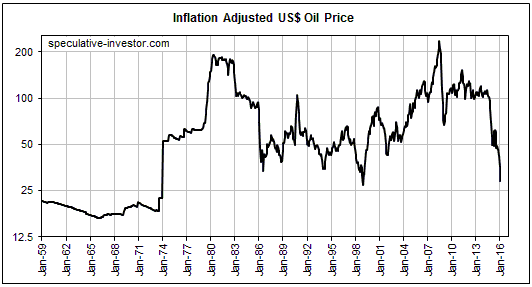
Last year, oil was the market we were most wrong about. We came into the year
expecting the oil price to base during the first half and to make a sustained
turn to the upside during the second half. Also, we thought that maximum
downside potential (prior to a sustained upturn) was to the mid-$30s.
Oil appeared to be basing as expected during the first half of last year, but
during the final few months of the year the bottom fell out and the price of
West Texas Intermediate has since traded as low as $27.50. In inflation-adjusted
terms*, this is below the 1986 low and close to the December-1998 low. Here's
the relevant chart (as at 21st January 2016).
For industrial metals, our perception of downside potential was in the right
ballpark early last year. In particular, we saw the potential for copper to drop
to the low-$2 area and for GYX (the Industrial Metals Index) to drop to around
250 prior to sustained upward reversals (the lows for 2015 ended up being
slightly below $2 for copper and around 240 for GYX). However, our timing was
wrong in that we expected all remaining downside to occur during the first half
of the year, whereas the declining price trends were clearly still in force at
year-end.
For this year there is no reason to make separate forecasts for different
industrial commodities, because they are in synch. They are all massively
'oversold' and poised for at least intermediate-term and possibly long-term
upward reversals from whatever lows are made during the first quarter.
A fundamentals-based argument for a general commodity reversal cannot be made,
because the supply-demand fundamentals are almost universally bearish. This,
however, is consistent with the possibility that a major price bottom is not far
away, the reason being that in the commodity markets the supply-demand
fundamentals always look very bearish near major price bottoms and very bullish
near major price tops.
If a major commodity-price turnaround happens within the next couple of months
it won't be because the so-called fundamentals suddenly start getting more
bullish; it will be due to the combination of sentiment, momentum and relative
valuation. In simple terms, after prices become too stretched in one direction
they begin to move in the opposite direction.
In the commodity markets, measures of negativity and downside momentum have
reached rare and in some cases unprecedented extremes. Also, the bottom section
of the following chart shows that the Goldman Sachs Spot Commodity Index (GNX)
has fallen to near its 2001 low relative to the S&P500 Index (SPX).

The only industrial commodity we'll single out is platinum. The first of the
following charts shows that in inflation-adjusted terms, the platinum price is
now at its lowest level since the late-1970s. The second of the following charts
shows relative to the gold price, the platinum price is now very close to a
50-year low.
The platinum market appears to have been hit harder than most other
industrial-commodity markets by weakness in China's economy, but there comes a
point where the worst-case scenario is fully discounted by the current price.
The platinum market is probably close to that point.
We expect platinum to make a major bottom in US$ terms, inflation-adjusted terms
and gold terms during the first quarter of 2016.**


*We use our own method of adjusting for the effects of inflation. The
method was first described in the 2010 article posted
HERE.
**It would be reasonable for investors to average into physical platinum,
either directly or via an ETF such as PPLT. We do not recommend platinum-mining
equities.