|
- Interim Update 1st February 2012
Copyright
Reminder
The commentaries that appear at TSI
may not be distributed, in full or in part, without our written permission.
In particular, please note that the posting of extracts from TSI commentaries
at other web sites or providing links to TSI commentaries at other web
sites (for example, at discussion boards) without our written permission
is prohibited.
We reserve the right to immediately
terminate the subscription of any TSI subscriber who distributes the TSI
commentaries without our written permission.
The
importance of marking to market
Thanks to a change in accounting regulations during the first half of 2009, banks in the US have been able to kid themselves and their investors regarding the values of assets shown on their balance sheets. More specifically, banks have been allowed to value assets such as real estate and mortgage-backed securities at unrealistically high levels. In this way, their balance sheets have been made to look healthier than is actually the case.
It's a good bet that the banks will end up getting away with the financial legerdemain mentioned above. After all, they got away with similar trickery in the past, most notably during the 1980s when the Fed allowed banks to inflate the accounting values of failed investments in Third-World government debt. The idea back then was the same as it is today, which is that large holes in bank balance sheets stemming from ill-conceived investments get filled over time via monetary policy geared to providing zero-risk profit opportunities to banks. In effect, the Fed allows the banks to avoid recognising large balance-sheet deficiencies on the basis that these deficiencies will be eliminated by gradually siphoning resources from the rest of the economy into the banks.
Some will argue that the Fed shouldn't do this, but such an argument misses the point that the main reason for the Fed's existence is to support the commercial banks. Neither the Fed nor any other central bank serves an ethical or economically useful purpose.
Due to the support they receive from the central bank, the large commercial banks are sometimes able to pretend that the prices of their investments are well above current market prices. However, other investors don't have this luxury. Investors like you -- assuming that you are not the operator of a large commercial bank being propped up by the Fed -- should always mark investments to market. Doing so is not important just because it happens to be good accounting practice, it is also important because it prevents you from falling into the psychological trap of believing that a decline in market value to below your purchase price doesn't constitute a real loss if you haven't yet exited the position.
The fact is that as soon as the market price of an investment you own falls below your cost, you have incurred a loss. You can choose to pretend that the loss doesn't exist on the basis that you haven't yet closed the position, but this doesn't change the reality that a loss has happened.
If you are an investor or a speculator then you will regularly incur losses. Losses are part and parcel of the investing/speculating business and usually aren't a big deal (at least, they shouldn't be a big deal if you do a reasonable job of managing risk). The point is that losses and profits should be accounted for as you go, because your decisions are more likely to be sensible if you formally acknowledge the reality of current market prices than if you pretend that price changes haven't happened. There may well be good reasons to believe that the reduction in the market value of an investment will be temporary, but it is still important to properly account for today's reality before looking forward. To put it another way, current and future decisions are more likely to be correct if they are based on an accurate accounting of what happened in the past.
In practical terms, if you are an active short-term trader then you should mark your portfolio to market at the end of every trading day. For most other traders it should be sufficient to mark your portfolio to market at the end of each week.
We mark our own portfolio to market each week.
Interesting
Quote
From "Worship of the
Mob":
"Mises has observed that "the critics of the capitalistic order always seem to believe that the socialistic system of their dreams will do precisely what they think correct." Hence, when people talk about the importance of democracy, it is never democracy as it has ever actually functioned, with the politicians that have actually been elected, and the policies that have actually been implemented. It is always democracy as people imagine it will operate once they succeed in electing "the right people" -- by which they mean, people who agree almost completely with their own views, and who are consistent and incorruptible in their implementation of the resulting policies. This is what allows an intelligent group of people to espouse mob rule as a desirable principle, even as they simultaneously commit acts that brand them as criminals worthy of imprisonment under the very social system they maintain."
Many intelligent people cling to the belief that the only reason socialism or other systems that involve government management of the economy have never worked in the past is that the right people haven't been in charge. It's the triumph of illusion over both logic and experience.The Stock Market
The S&P500 Index is probably on its way to resistance at 1340-1370, but this points to additional upside potential of only 2-4%. The first of the two most likely possibilities is that the resistance will be reached within the next few trading days. The second is that there will be a 1-2 week pullback and then a rise to test last year's peak.
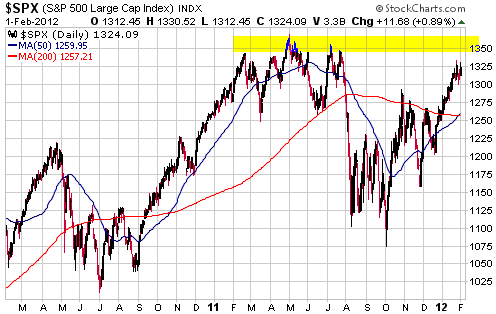
A test of last year's peak could be the prelude to an intermediate-term decline. The sentiment backdrop is certainly consistent with an intermediate-term peak being close at hand, but keep in mind that there is always more than one possible outcome.
We suspect that even if the market is nearing an intermediate-term peak in terms of both price and time, it will be difficult to make money on the 'short side' over the next few months. The main reason is that monetary conditions are very supportive and could become even more so due to the ECB's efforts to prop-up European banks and keep the euro-zone together. If the ECB is in the process of becoming more Fed-like, which seems to be the case, then a stock market peak could be followed by months of 'choppy' range-trading rather than a consistent downward trend.
Gold and the Dollar
Gold and Silver
Silver/gold ratio update
On 10th February of last year, in the midst of 'silver mania', we posted a TSI commentary in which we addressed the question of whether silver was likely to outperform gold over the year ahead. Our conclusion was that silver would underperform gold IF evidence of economic weakness became more pronounced and/or there was widespread fear of a crisis in the banking industry.
The aforementioned TSI discussion was subsequently posted as a free article
on several web sites, after which we were deluged with critical emails. The general flavour of the emails was: "How dare you insinuate that silver could possibly underperform gold under any circumstances!"
Note that while we had stated in TSI commentaries that silver would probably underperform gold over the course of 2011 due to the combined effects of the euro-zone sovereign debt predicament, weakness in the banking system and a global economic slowdown, in the article that drew the unusually large number of negative responses we made no such forecast. We simply pointed out the historical tendency for silver to underperform gold when growth-oriented speculations decline in popularity, especially when there is a financial/banking crisis.
Below is an updated version of the chart that was included in our February-2011 article. The chart compares the silver/gold ratio with the copper/gold ratio (the green line) and the S&P500 Index (the blue line). It isn't uncommon for these three entities to move in opposite directions on any given day, week or month, but it is clear from the chart that on an intermediate-term basis they usually trend in the same direction. In other words, the chart illustrates our point that the silver/gold ratio generally trends up and down with economic and financial-system confidence.
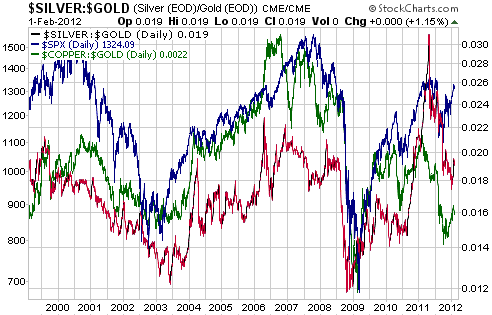
Recently, both silver and copper have strengthened relative to gold as the broad stock market has rallied. Our best guess at this stage is that the stock market's rally and the associated relative strength in the non-monetary metals will end within the first few months of this year.
Current Market Situation
In the 28th December Interim Update, when gold was trading at around $1550 and silver was trading at $26.50-$27.00, we wrote:
"...a relatively low-risk buying opportunity has arrived for both gold and silver. The opportunity could get better over the next couple of weeks, with gold perhaps falling back to the low-$1500s, but it probably isn't going to get a lot better."
It didn't get a lot better, in that gold bottomed in the low-$1500s and silver bottomed at around $26 a few hours after we posted the above.
Due to the price gains that have occurred during the intervening period, the risk/reward for new buying is significantly less attractive now than it was in late December. Silver's short-term upside potential, for example, is probably limited by the top of the channel drawn on the following daily chart, which equates to reward potential of around 10% from here. A normal pullback would take the price 7-10% lower, so we think that silver's risk and reward are now close to being in balance on a short-term basis.
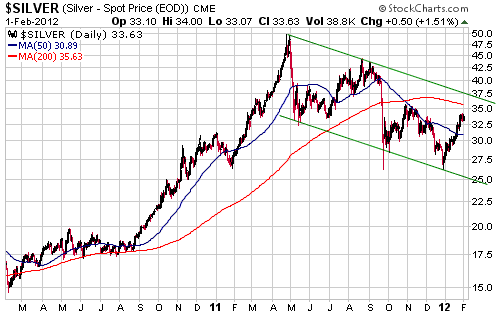
We suspect that gold and silver will maintain an upward bias into March, but the time for new buying has gone. The next short-term opportunity will more likely be the selling variety than the buying variety.
Gold Stocks
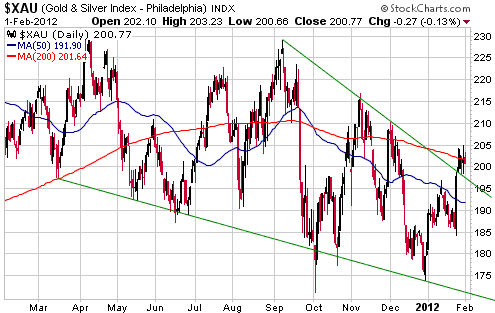
A daily chart of the XAU is displayed below.
Since breaking above a downward-sloping trend line last week the XAU has consolidated between 200 and 205. There could be some additional consolidation during the first half of this month encompassing a decline to as low as 195, but sentiment, price action and valuation all point to significant additional gains prior to the next multi-month top.
Currency Market Update
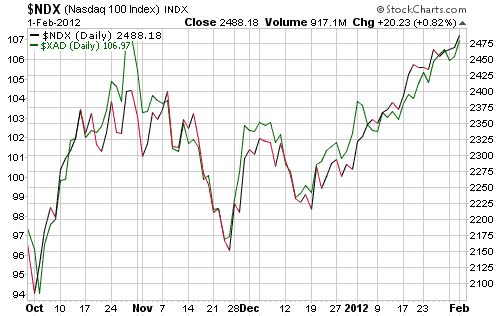
If you think that the Australian Dollar's performance on the foreign exchange market has something to do with its own fundamentals, the following chart should give you cause to re-think. The chart shows that the A$ and the NASDAQ100 Index (NDX) have moved in lockstep since the beginning of October. It seems that traders buy the A$ when large-cap US tech stocks rise and sell the A$ when large-cap US tech stocks fall.
The US$ is consolidating as the perceived need for a 'safe haven' diminishes and growth-oriented speculations increase in popularity. Our current expectation is that this situation will persist until March or perhaps even May, with the US$ strengthening during the weeks when equities and commodities pull back but overall maintaining a slight downward bias.
Update
on Stock Selections
Notes: 1) To review the complete list of current TSI stock selections, logon at
http://www.speculative-investor.com/new/market_logon.asp
and then click on "Stock Selections" in the menu. When at the Stock
Selections page, click on a stock's symbol to bring-up an archive of
our comments on the stock in question. 2) The Small Stock Watch List is
located at http://www.speculative-investor.com/new/smallstockwatch.html
 Gold-Ore Resources (TSX: GOZ). Shares: 85M issued, 91M fully diluted. Recent price: C$0.75 Gold-Ore Resources (TSX: GOZ). Shares: 85M issued, 91M fully diluted. Recent price: C$0.75
In mid December of last year GOZ agreed to merge with Astur Gold, but it was announced on Wednesday of this week that the proposed merger with Astur had been aborted. Instead, GOZ plans to merge with Elgin Mining (TSXV: ELG). Unlike the merger with Astur, the one with ELG involves a sizeable premium for GOZ shareholders. In this respect it is definitely a superior deal.
For each of their GOZ shares, GOZ shareholders are being offered one ELG share (ELG shares were trading at C$1.23 before being halted on Wednesday) plus half of a 2-year ELG warrant with an exercise price of C$1.30. The warrant 'kicker' greatly enhances the attractiveness of the offer because it provides GOZ shareholders with additional leverage to future upside.
We don't know anything about ELG apart from the few details that were included in the press release announcing the merger. The company has two development-stage projects in Nunavut (northern Canada) and is run by Patrick Downey, a well-respected operator in the mining world. Downey will be the CEO of the combined company.
We will have more to say about the GOZ-ELG merger in the Weekly Update after we have had a chance to do some research on ELG, but our initial reaction is positive. Provided that at least one of ELG's projects looks good we will likely maintain our position in GOZ with the aim of obtaining ELG shares and warrants when the merger is completed. It is also worth noting that GOZ is now in play, meaning that an even better bid could
materialise.
Sandspring Resources (TSXV: SSP). Shares: 108M issued, 120M fully diluted. Recent price: C$1.14
SSP's stock price began falling a few hours after the company announced an updated resource estimate and PEA (Preliminary Economic Assessment) on Monday. By the close of trading on Wednesday SSP was at a new 52-week low.
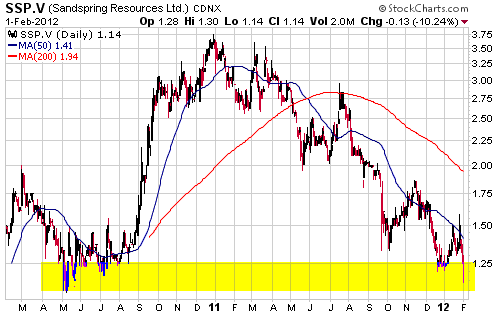
The stock's reaction to the news is puzzling, because the news was bullish. Of particular importance, the size of the overall resource at SSP's Guyana-based Toroparu project has increased by almost 20% to 10M ounces (6M M&I plus 4M Inferred) and the quality of the resource has improved (ounces have moved from "Inferred" to "M&I" and the average grade is now slightly higher). Also, the project is estimated to have an after-tax NPV (5%) of $850M (about $7/share) at a gold price of $1400/oz.
SSP will have to do a sizeable equity financing within the next 12 months, but the company presently has about $14M of working capital and therefore shouldn't be under pressure to do an immediate financing. That being said, the managers of many junior Canadian mining companies are seemingly incapable of saying no when offered the opportunity to raise money at value-destroying prices. We therefore can't rule out the possibility that the stock was sold down in anticipation of a financing.
The most likely explanation for this week's sell-off in SSP shares is that an institution wanted to get out for reasons that have nothing to do with SSP's underlying value and took advantage of the increased liquidity stemming from the good news.
SSP is currently one of the best buys in the world of exploration-stage gold mining stocks.
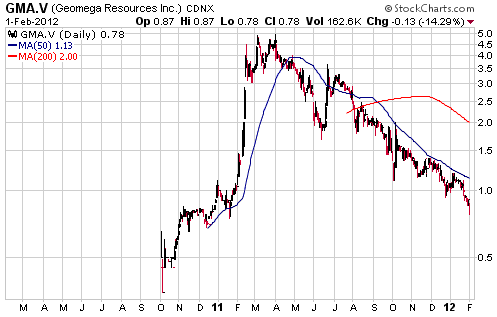
Speculative Idea: Geomega Resources (TSXV: GMA). Shares: 23M issued, 29M fully diluted. Recent price: C$0.78
GMA is developing the Montviel REE (rare earth element) project in Quebec. This project has an Indicated resource of 184M tonnes averaging 1.45% TREO (total rare earth oxides), which makes it one of the world's largest REE deposits outside China. Within the Indicated resource is 446M kg of Nd2O3 (Neodymium Oxide) -- the equivalent of about $90B of Nd2O3 at the current market price. Neodymium is most commonly used to make permanent magnets and has a fast-growing market.
GMA was brought to our attention by www.metalaugmentor.com. The MetalAugmentor team does first-rate fundamental research and is bullish on GMA, but that certainly doesn't guarantee that GMA will be a success. This is a risky and illiquid stock that could be worth at least an order of magnitude more than its current price and could also be worth almost nothing, depending on what happens with REE prices and the engineering work that will be done on the Montviel project over the quarters/years ahead. Since the market is currently valuing the project at almost nothing, the risk/reward is interesting.
This stock is too thinly traded and speculative to be a formal TSI recommendation, but we have added it to the
TSI Small Stocks Watch
List.
Duoyuan Global Water (Former Symbol: DGW. New Symbol: DGWIY). Recent price: US$1.20
DGW, a Chinese water treatment company, was removed from the TSI Stocks List in April of last year, but some of our readers still own it. The stock was recently de-listed from the NYSE following a long suspension and now trades on the "Pink Sheets" market in the US under the symbol DGWIY.
If its management can be believed then the company has a profitable business, no debt and around US$6/share of cash. As far as we know there is no definitive evidence that the company is anything other than what it claims to be, but there are reasons to doubt the forthrightness of the company's senior management. For example, an independent examination of the company's accounts and business could not be completed last year because the independent experts were denied access to the information they needed.
The situation now is that DGWIY could be worth a multiple of its current price, but there is no way of verifying its true value and no good reason to trust the company's management. Our suggestion, therefore, is to look for an opportunity to exit.
Chart Sources
Charts appearing in today's commentary
are courtesy of:
http://stockcharts.com/index.html

|
