![]()
![]()
![]()
![]()
- Interim Update 1st February 2017
Copyright
Reminder
The commentaries that appear at TSI
may not be distributed, in full or in part, without our written permission.
In particular, please note that the posting of extracts from TSI commentaries
at other web sites or providing links to TSI commentaries at other web
sites (for example, at discussion boards) without our written permission
is prohibited.
We reserve the right to immediately
terminate the subscription of any TSI subscriber who distributes the TSI
commentaries without our written permission.
As expected, the Fed
does nothing
At the FOMC Meeting that
concluded on Wednesday 1st February the Fed made no change to its targeted
interest rate and made no significant alterations to the wording of its
policy statement. This lack of change is what almost everyone was
expecting. So, what now? When should we expect some significant action
from the Fed?
The snail's pace at which the Fed has moved along the
so-called "policy normalisation" path to date (only two 0.25% rate hikes
during the first 14 months of the campaign) suggests that a genuine
tightening of monetary policy is still a long way into the future. It is
almost certainly not going to happen this year.
It's important to
understand that for an action by the Fed to count as genuine monetary
tightening it will have to reduce the amount of reserves in the banking
system, which, in effect, means that it will have to reduce the size of
the Fed's balance sheet. In the good old days, hikes in the Fed Funds Rate
(FFR) were implemented by removing reserves from the banking system. But,
as most recently explained in the 30th January Weekly Update, hiking the
FFR now involves injecting reserves INTO the banking system and is
therefore not a form of genuine monetary tightening.
The Fed will
probably make at least one 0.25% increase in the FFR this year, but
according to a
recent blog post from former Fed Head Bernanke the process of
shrinking the Fed's balance sheet won't even begin until the
"normalisation" of the Fed Funds Rate is well underway. As summed up by
"the Bernank": "rate increases first, balance sheet reduction later."
So, if there is a tightening of US monetary conditions during 2017 it
will be driven by the market (a slowdown in the rate of commercial bank
credit expansion), not the Fed.
Commodities
The only commodity
supply-demand indicator that matters
For a commodity with
a liquid futures market, the "term structure" of the futures market is the
most useful -- perhaps even the only useful -- indicator of whether
physical supply is tight, abundant or somewhere in between.
The
term structure of a commodity futures market is the prices of futures
contracts for the commodity over all available expiration months. It can
be displayed as a chart, with price along the vertical axis and the
expiration months along the horizontal axis. Examples for oil and copper
are shown below.
If a market is in "contango" then the later the
delivery month the higher the price, resulting in the chart of the term
structure being an upward-sloping curve. If a market is in "backwardation"
then the earlier delivery months will have the higher prices and the term
structure will be represented by a downward-sloping curve. It is also
possible for the curve representing the term structure to have an upward
slope over some future delivery periods and a downward slope over others.
This mostly happens with commodities that experience large seasonal swings
in production (e.g. grains) or consumption (e.g. natural gas), although it
can also happen with other commodities.
For an industrial commodity
such as oil or copper it will be normal for the term-structure curve to
slope upwards, that is, for the market to be in "contango", with the
extent of the "contango" reflecting the cost of physical-commodity
storage. To further explain, let's say you are a large-scale commercial
consumer of oil and you estimate that you will need X barrels of the stuff
in August of this year. In this case, if you don't want to assume any
price risk you can either take delivery of physical oil immediately and
store it until August or you can buy oil for delivery in August
(August-2017 oil futures). It will make sense to buy the physical oil if
the cost of storage and financing is less than the premium over the spot
(cash) price that you would have to pay for the August futures contracts.
Otherwise, it will make sense to buy the futures and take delivery when
the oil is needed in August.
It is, however, possible for a
commodity such as oil to go into backwardation, that is, for the later
delivery months to trade at a discount to the earlier delivery months and
the spot price. Such a situation would create a risk-free profit for a
commercial trader with excess oil on hand ("excess oil" being oil that
will be needed by the trader in the future but isn't needed immediately),
because the trader could sell his excess physical supply on the spot
market and lock-in his future supply needs by purchasing futures contracts
at a discount to spot. In doing so he would not only pocket the difference
between the spot and futures prices, he would also save on storage costs.
Due to the attractive arbitrage opportunity that would be presented by
backwardation, it's a situation that will usually arise only if there's a
shortage of currently-available physical supply. Backwardation, or a
downward-sloping term-structure curve, is therefore a clear sign that the
physical market is tight. By the same token, if the physical supply
situation is genuinely tight then the market will either be in
backwardation or the positive slope of the term-structure curve will be
much gentler than usual.
Sometimes the term-structure curve will
have a steeper upward slope than usual, that is, the later delivery months
will trade at larger-than-usual price premiums to the earlier delivery
months and the spot price. This will create an opportunity for traders to
make risk-free profits by selling the futures and buying the physical,
unless there is presently so much physical supply bidding for storage
space that the price of storage is high enough to eliminate the potential
arbitrage profit. Since risk-free arbitrage opportunities tend to be
fleeting, a term-structure curve with a steeper-than-usual upward slope
indicates an abundance of currently-available physical supply.
What
about the reported inventory levels for commodities such as oil and the
base metals? Is this information useful?
In general, no, because a
lot of aboveground supply is not held in the storage facilities that are
covered by such reports. There will be times when a relative shortage or
abundance of physical supply is correctly signaled by the widely-reported
inventory levels, but in such cases the evidence of shortage or abundance
will also appear in the "term structure". And the "term structure" will be
more reliable, meaning that it will generate fewer false signals.
A
final point worth making is that a bearish supply-demand situation doesn't
necessarily mean that the price will fall and a bullish supply-demand
situation doesn't necessarily mean that the price will rise. For example,
at around this time last year we wrote that a strong rally in the oil
price would probably soon begin even though oil's supply-demand situation
was as price-bearish as it ever gets. Part of our reasoning was that with
the oil price having already dropped to near a 50-year low in real terms,
the worst-case scenario had been factored into the current price. Also,
after the fundamentals become as bearish (or bullish) as they ever get,
what's the most likely direction of the next move?
Supply-demand fundamentals for oil and copper
Displayed
below are charts showing the current term structures for oil (basis West
Texas Intermediate crude on the NYMEX) and copper (basis the Comex).
Oil's term structure suggests that the physical market is very well
supplied at this time, although the fundamental backdrop appears to be a
little less price-bearish now than it was two months ago. Also, the
flattening of the curve from late-2017 onwards points to an expectation
that the supply situation will tighten in 2018.
Copper's term
structure suggests a physical supply-demand situation in balance. It
contains no evidence of a current physical shortage (since the curve has
an upward slope), but with a difference of only a few cents between the
nearest futures and the most distance futures it would take a relatively
small downward shift in supply or upward shift in demand to create a
shortage.
By the way, in the copper market the London Metals
Exchange (LME) is far more important than the Comex, so it would be better
to use the term structure on the LME than the term structure on the Comex.
However, we don't have access to LME data.
The Stock Market
The US
As mentioned in the latest Weekly Update, a potentially important bearish
divergence is developing between the US stock market's internal strength
(the broadness of participation in the rally) and the senior stock
indices. The divergence could continue for another 1-2 months before it
matters, but if it does continue then it will matter (it will likely
usher-in an intermediate-term decline) in the not-too-distant future.
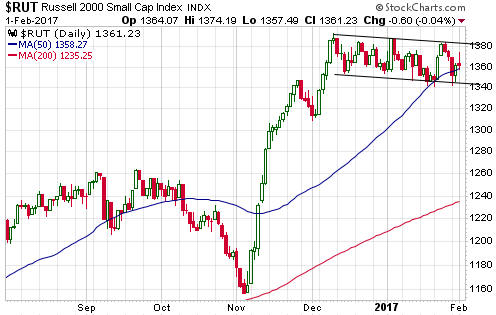
There are less-important, but still interesting, bearish
divergences/non-confirmations between some of the stock indices. In
particular, whereas the S&P500, the Dow Industrials and the NASDAQ100
broke above their December highs in January, the Russell2000 Small Cap
Index (RUT) and the Dow Transportation Average (TRAN) have not yet managed
to do so.
The first of the following daily charts shows that the
RUT has been drifting downward within a channel since the second week of
December. This currently looks more like a consolidation pattern than a
topping pattern, but a daily close below 1340 would suggest that it was,
instead, a topping pattern.
The second chart shows that the TRAN
possibly double-topped at 9500 during December-January, although at this
stage the pullback from the second high has done no more than test the
50-day MA. A daily close below 9000 would be ominous, whereas a daily
close above 9500 would remove the bearish non-confirmation.
The scene is being set for an intermediate-term stock market peak
during the first quarter of this year, but there is no evidence that the
top is already in place.
Gold and the Dollar
Gold and Silver
In the latest Weekly Update we wrote that this week's FOMC
Announcement would probably be a non-event for the gold market, which
turned out to be the case. It's doubtful that the Fed will do anything
over the next few months that puts upward or downward pressure on the gold
price, but we will, of course, take the evidence as it comes.
Last
week, gold pulled back to near its 50-day MA. This is normal behaviour for
a correction within a short-term upward trend. It has since rebounded and
on Tuesday of this week it tested its year-to-date high of $1220.
A
daily close above $1220 would indicate that the price was probably on its
way to the vicinity of the 200-day MA, which is now in the mid-$1260s.
Unlike the US$ gold price, the US$ silver price broke out to a new
high for the year during the first half of this week. This week's
relatively good performance by silver was forewarned by last Friday's
price action, when the silver price accomplished an "outside up" day.
We think that $18.50-$19.00 is a realistic short-term upside target
for the silver price.
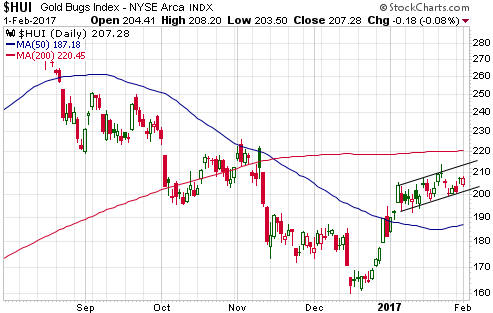
Gold Stocks
Even though there has been a
slight upward bias, we view all of the HUI's price action since 5th
January as a consolidation. We therefore expect an eventual upside
breakout from the channel drawn on the following chart.
It's a similar story with GDXJ, an ETF proxy for the junior end of the
gold-mining sector. In GDXJ's case the top of the upward-sloping
consolidation pattern is defined by the 200-day MA on the following chart,
but we could also draw a channel like we did in the above chart of the
HUI. Whether we use a channel line or the 200-day MA we come to the
conclusion that short-term resistance for GDXJ lies at $38.50-$39.00.
As an aside, it's possible for different charting services to show
different levels for exactly the same moving average. For example, the
current level of GDXJ's 200-day simple moving average as calculated by
stockcharts.com and shown in the following chart won't necessarily be the
same as the current level of the 200-day simple moving average calculated
by another charting service. The difference stems from the way that
dividends are treated. For example, in the following chart from
stockcharts.com the historical prices have been dividend-adjusted, which
means that they have been lowered by the amounts of the dividends issued
by the ETF in the past. This causes the calculated level of the 200-day MA
to be lower than it would be if the raw price data were used.
To
get raw (dividend-unadjusted) price data in a stockcharts.com chart, put
an underscore before the stock symbol. For example, use _GDXJ.
We expect upside breakouts by the gold-mining indices and ETFs from
their ranges of the past four weeks, but there is always more than one
plausible scenario. In this case, a daily close below 200 by the HUI or
below $36 by GDXJ would warn that something different (to what we expect)
was happening.
The Currency Market
We've
mentioned that support at 97.5 probably defined the maximum downside for
the short-term correction in the Dollar Index that began in December. With
support at 100 having been breached this week, the maximum downside target
(97.5) is now the most likely place for the correction to end.
About three weeks ago the Canadian Dollar (C$) made a marginal break
above resistance at 76.5 that immediately failed. However, the ensuing
decline held near the 50-day MA and has been followed by a quick return to
the aforementioned resistance. In fact, there was another marginal break
above resistance during the first half of this week.
The latest
break above resistance has a better chance of being sustained. If it is
sustained then the 1-2 month target will be last year's high at 79.5-80.0.
In late breaking news, British Members of Parliament have voted by a
huge majority to approve the triggering of Article 50 of the Lisbon
Treaty. This makes it very likely that Article 50 will be triggered before
the end of March, enabling the formal process of separating the UK from
the EU to begin.
Updates on Stock Selections
Notes: 1) To review the complete list of current TSI stock selections, logon at
http://www.speculative-investor.com/new/market_logon.asp
and then click on "Stock Selections" in the menu. When at the Stock
Selections page, click on a stock's symbol to bring-up an archive of
our comments on the stock in question. 2) The Small Stock Watch List is
located at http://www.speculative-investor.com/new/smallstockwatch.html
![]() Addition
to the TSI Stocks List: Sandfire Resources (ASX: SFR). Shares: 158M.
Recent price: A$6.61
Addition
to the TSI Stocks List: Sandfire Resources (ASX: SFR). Shares: 158M.
Recent price: A$6.61
In last week's Interim Update we
introduced Avanco Resources (AVB.AX) and Sandfire Resources (SFR.AX). Both
are copper producers with profitable production, strong balance sheets and
interesting valuation-related upside potential. Neither was added to the
TSI List at the time.
We were hoping for some near-term price
weakness to create an even better opportunity to add the stocks, but
there's a risk that we won't get it. In fact, AVB has gained about 25%
since the TSI write-up and is no longer the value proposition it was just
one week ago, although we expect that it will trade well above current
levels within the next several months. SFR has also risen since last
week's write-up, but only by a few percent.
To avoid missing the
boat we are going to bite the bullet (and, obviously, mix metaphors) and
add SFR to the TSI List at its current price of A$6.61.
As
mentioned last week, at a copper price of US$2.50 and an A$/US$ exchange
rate of 0.75 we estimate that SFR shares would be fully valued at around
A$10.40. The current copper price is US$2.70, but at this stage we aren't
comfortable using a price of more than $2.50 in our valuations.
The
stock is a little 'overbought' in the short-term, but when we take a
long-term view (see below) we see a base that has been four years in the
making.
Chart Sources
Charts appearing in today's commentary
are courtesy of:
http://stockcharts.com/index.html
http://bigcharts.marketwatch.com/
![]()