|
- Interim Update
1st April 2015
Copyright
Reminder
The commentaries that appear at TSI
may not be distributed, in full or in part, without our written permission.
In particular, please note that the posting of extracts from TSI commentaries
at other web sites or providing links to TSI commentaries at other web
sites (for example, at discussion boards) without our written permission
is prohibited.
We reserve the right to immediately
terminate the subscription of any TSI subscriber who distributes the TSI
commentaries without our written permission.
The US
manufacturing slowdown continues
During the first few days of every month the financial markets
are always focused on the monthly US employment numbers, the next
set of which will be published on Friday 3rd April, but we are
always more interested in the ISM manufacturing numbers, the latest
set of which was published on Wednesday 1st April. The employment
numbers are significant to the extent that they influence the Fed,
but as economic indicators they aren't useful. The ISM manufacturing
numbers, on the other hand, are significant because they are
reliable indicators of how the economy is currently performing and
how it will likely perform in the near future.
Of the ISM Report's components, the most useful is the New Orders
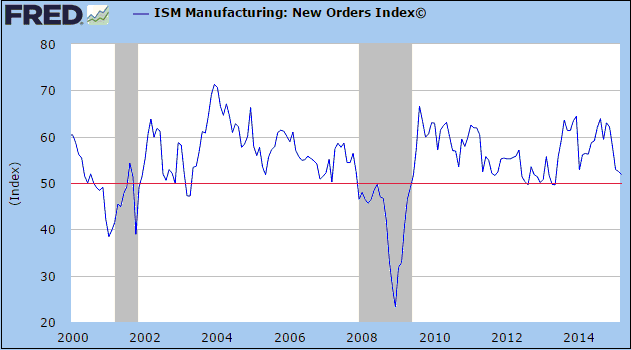
Index. The New Orders Index for March was slightly below the
February reading and extended the downward trend that began in the
final quarter of last year. Here's the relevant chart.
As we've noted in previous commentaries, a warning signal of an
imminent recession would be generated by a solid break below 50 --
say, to 48 or lower -- in the ISM Manufacturing Report's New Orders
Index. There is almost no chance that the US economy would enter
recession without the New Orders Index having broken solidly below
50 and it is unlikely that a solid break below 50 would happen
unless the economy had just entered or was about to enter recession
territory. Note that there were a few occasions during 2011-2013
when this index dropped to the low-50s, but on each of these
occasions there was no follow-through to the downside and therefore
no recession signal.
The current position of the New Orders Index suggests a sluggish,
but not a recessionary, economy. However, it wouldn't take much
additional weakness from here to generate a reliable warning signal
of imminent recession.
The economic slowdown reflected by the recent decline in the New
Orders Index is related in part to the retrenchment in the US oil
industry stemming from the collapse in the oil price. It is also
related to economic weakness outside the US, as evidenced by the
fact that the New Export Orders sub-index is well below 50. Many US
exporters will blame the stronger US$ for the decline in export
orders, but it's far more likely that the stronger US$ is partly an
effect of the same global economic weakness that's causing export
orders to shrink.
The Stock Market
The US
The Big Picture
Two long-term stock-market indicators generated bearish warning signals last
year. We are referring to the downward reversals from extreme highs in NYSE
Margin Debt and the SPX/USB ratio (the S&P500 Index relative to the T-Bond).
These reversals suggested that a major topping process had begun.
Although the S&P500 Index made a new all-time high as recently as the first
trading day of March this year, the idea that a major top began to form last
year is not farfetched. This is because the SPX's March-2015 high was only about
5% above its September-2014 high and because the NYSE Composite Index (NYA) has
been unable to break above its July-2014 peak.
That being said, the bearish warning signal generated by the first of the
above-mentioned long-term indicators has been cancelled by the most recent data.
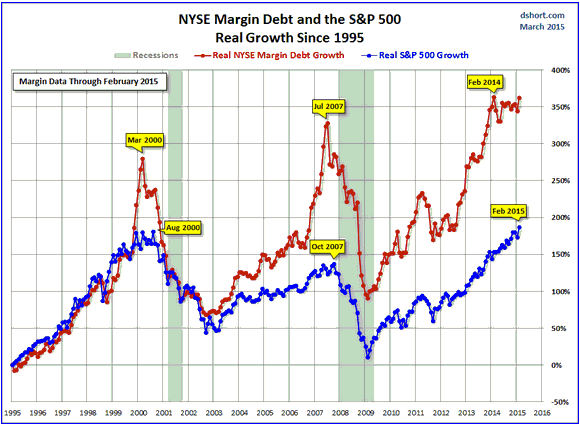
As illustrated by the following chart, which was extracted from the article
posted
HERE, the data for February-2015 (the latest available) show that
"inflation"-adjusted NYSE Margin Debt has returned to the peak reached in
February of last year. It hasn't yet made a new high, but its performance no
longer has anything in common with its performance near the major peaks of 2000
and 2007.
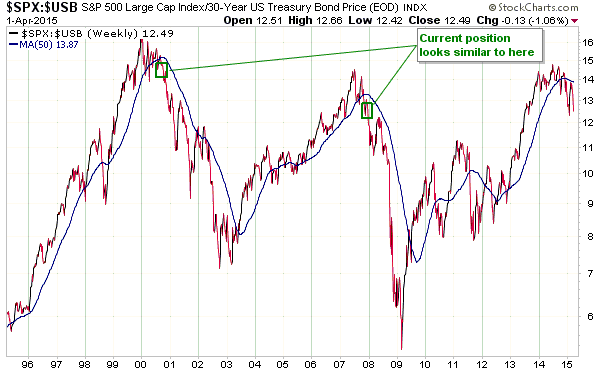
As illustrated by the next chart, the SPX/USB's bearish warning signal is
intact. The signal was generated last October when, after having previously
risen above 14, the SPX/USB ratio broke below its 50-week moving average (MA).
It has since remained below this MA and the MA itself has since turned down. As
a result, SPX/USB's current position looks similar to its position in late-2000
and late-2007.
SPX/USB's long-term bearish signal would be cancelled by a weekly close above
the 50-week MA.
Current Market Situation
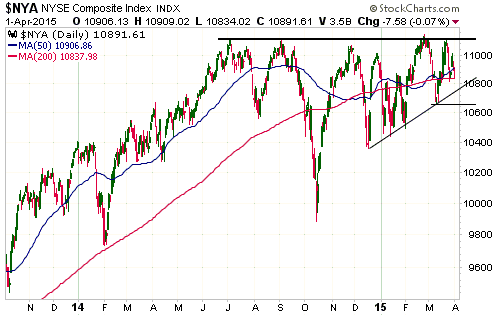
The NYSE Composite Index (NYA) peaked last July and has since tested that peak
on either three or four separate occasions, depending on whether or not the
November rise to a slightly lower peak counts as a test. When there are three or
more tests of a lateral support/resistance level it usually means that a
breakout will eventually happen, so the chart pattern puts the odds in favour of
the NYA moving to a new all-time high within the next few months.
However, the chart pattern doesn't tell us anything about what would likely
happen following a break to a new all-time high. For example, we pointed out in
previous commentaries that breaks above well-defined resistance levels happened
just prior to major tops in 2000 and 2007. Also, the probability of an eventual
upside breakout would definitely be reduced by a daily close below the March
low, as such a development would break the sequence of rising bottoms that began
during the final quarter of last year.
The NYA's current position is roughly mid-way between major resistance defined
by its highs of the past year and short-term support defined by its early-March
low. This means that the NYA is presently in 'no man's land'. It will have to
break one way or the other to provide us with some information, which,
fortunately, it is likely to do this month.
To validate our preferred short-term scenario,
the NYA will soon have to break below its early-March low.
Gold and the Dollar
Gold
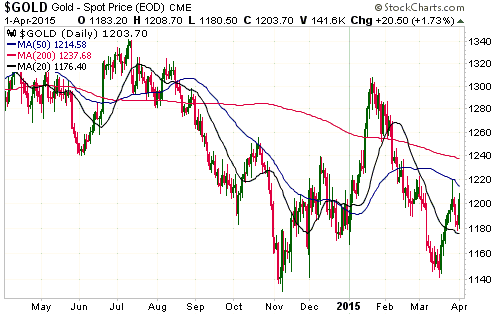
Gold's upward spike and downward reversal on Thursday 26th March created a
near-term top. As noted in the latest Weekly Update, it probably completed the
first stage of a multi-week rebound and set the scene for some consolidation in
the $1175-$1205 range.
Gold ended up trading as low as $1178 on Tuesday of this week and then quickly
returned to $1200 on Wednesday in reaction to signs of weakness in the US
economy. This probably means that the consolidation is over and the next leg up
has begun. It also means that $1178 is now a significant support level. For the
short-term upside targets mentioned below to remain valid, the US$ gold price
must not close below $1178.
The 200-day MA near $1240 continues to be a viable target for the overall
rebound from the March low, but it's certainly possible that a higher price --
the high-$1200s, for example -- will be reached prior to the next short-term
top. We'll need to take it one step at a time, monitoring sentiment indicators
such as the COT situation and related markets along the way.
Looking beyond the next few weeks, we still think that the odds are in favour of
the US$ gold price breaking below last year's low prior to the start of a major
rally. This view is based on the S&P500's move to a new all-time high in
February and the current fundamental backdrop, but is not set in stone. The
fundamental backdrop could become more gold-bullish via, for example,
confirmation of an upturn in the US yield-curve.
Gold Stocks
The HUI completed its 6th consecutive down-day on Tuesday and then rallied with
the gold price on Wednesday. Wednesday's gain was enough to recoup the losses of
the preceding four days and achieve a daily close above the 20-day MA.
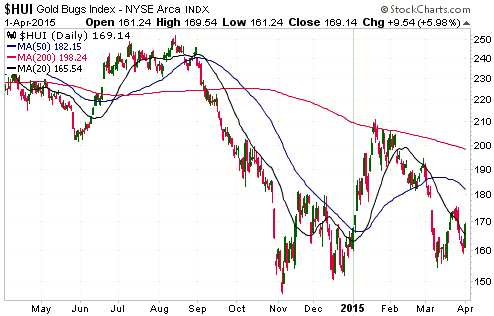
A pullback low was probably put in place on Tuesday, but the price action
doesn't imply that there will be immediate additional upside. Immediate
additional upside is one possibility, but an equally likely near-term outcome
involves a test of Tuesday's low within the next three trading days. Either way,
we suspect that the HUI will break above its March high within the coming two
weeks.
The 200-day MA, which is now just below 200, was the target we originally had in
mind for the HUI's overall rebound from its March low, but the HUI's recent
weakness relative to gold bullion indicates that it might not get that high.
The HUI will encounter a lot of resistance in the 180-200 range, and -- assuming
that the overall rebound from the March low is still in progress -- will
potentially make a rebound peak closer to the bottom than the top of this range.
However, a lot will obviously depend on where gold bullion makes its next
short-term peak.
The Currency Market
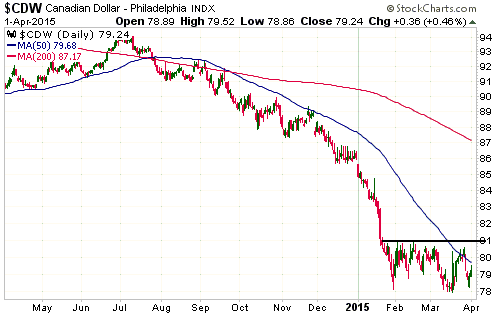
The Canadian Dollar (C$) has spent the past two months building a base, or what
currently looks like a base, in the 78-81 range. A daily close above 81 would
complete the base and create an initial chart-based objective of 84. Also, an
upside breakout by the C$, one of the two most important commodity currencies,
would be a preliminary sign that the average commodity price was entering an
intermediate-term rising trend.
Updates
on Stock Selections
Notes: 1) To review the complete list of current TSI stock selections, logon at
http://www.speculative-investor.com/new/market_logon.asp
and then click on "Stock Selections" in the menu. When at the Stock
Selections page, click on a stock's symbol to bring-up an archive of
our comments on the stock in question. 2) The Small Stock Watch List is
located at http://www.speculative-investor.com/new/smallstockwatch.html
Chart Sources
Charts appearing in today's commentary
are courtesy of:
http://stockcharts.com/index.html
http://research.stlouisfed.org/

|

