![]()
![]()
![]()
![]()
- Interim Update 1st May 2019
Copyright
Reminder
The commentaries that appear at TSI
may not be distributed, in full or in part, without our written permission.
In particular, please note that the posting of extracts from TSI commentaries
at other web sites or providing links to TSI commentaries at other web
sites (for example, at discussion boards) without our written permission
is prohibited.
We reserve the right to immediately
terminate the subscription of any TSI subscriber who distributes the TSI
commentaries without our written permission.
The Monthly Closing
Prices
At around this time every month
we review some of the most important (from our perspective) monthly
charts. We do this because monthly closing prices can confirm or deny
intermediate-term trend changes.
A month ago we wrote:
"Gold
could spike down to $1250 or a little lower during April without adversely
affecting its intermediate-term (3-12 month) prospects, but to maintain
its intermediate-term bullish posture it must stay above $1280 on a
monthly closing basis."
Gold traded below its 21-month MA (the
blue line on the following chart) and low enough to test its 8-month MA
(the black line on the following chart) during April, but ended the month
above $1280 and both of the aforementioned MAs. This means that gold's
position on the monthly chart remains bullish.
Unlike the
gold-mining sector and the silver market, the gold market is yet to
generate a significant bearish signal.
Over the past 2-3 weeks the gold-mining sector generated multiple
bearish signals. The latest was GDX's April close below its 21-month MA
(the blue line on the following chart).
The SPX/euro ratio generated a bearish signal when it ended the month
of December-2018 below its 20-month MA, but the signal was invalidated the
following month. SPX/euro has just made a new all-time high, providing
further evidence that a bear market did not begin last year.
There's a high probability that the T-Bond entered a bear market in
2016. As previously mentioned, we expect that the 84-month MA will act as
resistance during the bear market similarly to how it acted as support
during the preceding bull market.
A month ago we noted that the
T-Bond had ended March-2019 slightly above its 84-month MA. Our conclusion
was that it had reached a potential ceiling and that April probably would
be a down month. The following chart shows that the T-Bond lost 2.2 points
during April, which is consistent with our expectation that the 84-month
MA will act as resistance.
Note that we are allowing for the
possibility that the March-2019 rebound high will be tested before the
next leg of the bear market gets underway.
US Recession
Watch
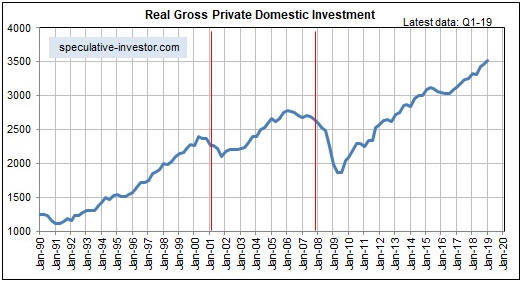
Our three favourite leading
indicators of US recession are the ISM New Orders Index (NOI), Real Gross
Private Domestic Investment (RGPDI) and the yield curve. All three of
these indicators should generate warning signals ahead of the next
recession.
The latest monthly NOI was reported on Wednesday 1st May
and revealed that there was a substantial decline in this measure of
manufacturing-industry strength in April. The index has dropped to near
the 2-year low reached in December-2018 and is now precariously close to
the level it would have to move below (the red line on the following
chart) to warn of a recession.
The latest quarterly RGPDI number (for Q1-2019) was published last
week. As illustrated below, RGPDI extended its upward trend and made a new
all-time high in Q1-2019. Given the typical historical lag between a
downward reversal in RGPDI and the start of a recession, this suggests
that a recession won't begin earlier than the final quarter of 2019.
The yield curve generates a recession warning when it 'flattens' to an
extreme and then begins to steepen, regardless of whether or not the
extreme entails an inversion.
The US yield curve is indicated on
the first of the following charts by the 10yr-2yr yield spread and on the
second of the following charts by the 10yr-3mth yield spread. Previously
we focused on the 10yr-2yr spread when assessing the yield-curve trend,
but, to minimise the risk of being whipsawed, from now on we will require
that a reversal be signaled by both of the spreads depicted below.
Both spreads have widened a little over the past month, but not by enough
to signal a trend reversal.
Based on the latest data, our rough estimates of recession start-time
probabilities are:
- Q2-2019: 5% (unchanged from a month
ago)
- Q3-2019: 15% (not specified a month ago*)
-
Q4-2019: 30% (not specified a month ago*)
- Later than 2019: 50%
(unchanged from a month ago)
Overall, there was no significant
change in recession start-time probabilities last month. In effect, the
strength signaled by the extension of RGPDI's upward trend was offset by
the plunge in the ISM New Orders Index.
*A
month ago we didn't have separate probabilities for Q3 and Q4 2019, but we
did have a probability for a recession start in H2-2019. Over the past
month the probability of a recession starting in H2-2019 is unchanged at
45%.
The Stock Market
The S&P500 Index (SPX) made a
marginal new all-time high on Tuesday of this week that was confirmed by a
new all-time high for the NYSE Advance-Decline Line (ADL). It then pulled
back on Wednesday.
At this point, a decline to the 50-day MA (2846
and rising) or lateral support at 2800 would be a normal correction.
Given the continuing upward trend in the ADL we aren't expecting
anything more bearish than a correction over the next few weeks. That
being said, the low monetary inflation rate makes the market acutely
vulnerable to a shift away from risk. We mean that a relatively small
increase in the demand to hold cash (a natural consequence of greater risk
aversion) could result in a very fast unwinding of bullish speculations.
We are thinking of something along the lines of what happened in
January-February of 2018, when the SPX lost 11% of its value within the
space of about two weeks. The decline could even take the form of a "flash
crash".
We wouldn't attempt to trade the aforementioned short-term
risk, but with the SPX testing last year's high it would make sense to
take an INITIAL longer-term bearish position at this time. The position
could be in the form index put options with an expiry date of
January-2020, or a leveraged inverse index fund such as SDS or QID. The
idea would be to make a quick exit (at a profit) if the "flash crash" risk
materialises or otherwise to methodically add to the position over the
next few months in readiness for a large decline later this year.
Gold and the Dollar
Gold
The
following daily chart shows that the US$ gold price oscillated in a narrow
range bounded by its 20-day MA and lateral support at $1280 during the
first three days of this week. Note, though, that the chart doesn't
include the post-FOMC price action. In the aftermath of the Fed news the
gold price dropped into the $1270s, but at the time of writing it hasn't
broken below last week's low.
Despite the financial-market volatility added by the Fed news, the
gold market's position now is not materially different to what it was at
the end of last week. The following comments from the latest Weekly Update
therefore still apply, except that resistance has edged down from $1302 to
$1300.
"Friday's up-move ended at the 20-day MA and there is
significant additional resistance in the form of the 50-day MA and a
downward-sloping trend-line only 1% above the current price (at $1302), so
the gold market still has some heavy lifting to do to confirm an upward
trend reversal. However, it's likely that at least a multi-week price low
is in place.
There's a realistic chance that gold will test its
February high within the coming month, but first it has to get above
resistance at $1302."
Silver
On
Wednesday the silver price fell from the top to the bottom of its
'declining wedge' pattern.
Due to Wednesday's price action, the following paragraph from the 22nd
April Weekly Update is worth repeating:
"Declining wedge
patterns generally are viewed as bullish, but in our experience they
aren't reliable enough to risk money on. The main reason we have drawn the
pattern on the following chart is to illustrate silver's reducing
volatility. The market is 'coiling' and should soon (within the next two
weeks) either resume the upward trend that began last November or
accelerate downward. The former obviously would be more bullish in the
short-term, but the latter could set the stage for a more bullish
intermediate-term outcome."
Silver still hasn't broken out of
its 'wedge', but over the past three days it has 'pushed the envelope' --
first by making a failed attempt to break out to the upside and now by
dropping as far as it can go without breaking out to the downside.
A downside breakout could lead to a quick decline to near major support at
$14.00, which certainly would be an excellent long-term buying opportunity
and possibly would be an excellent short-term buying opportunity. Whether
or not it was an excellent short-term buying opportunity would have to be
determined at the time by looking at sentiment indicators.
As
mentioned in the latest Weekly Update, an upside breakout from the 'wedge'
probably would be followed by a rebound to the $15.60s.
Gold Stocks
At the end of last week we thought that the
gold-mining sector, as represented by GDX, had commenced a minor rebound
(a counter-trend move to resistance within an on-going short-term downward
trend), but it wasn't to be. Instead, we got a 3-day bounce that
culminated last Friday (we were anticipating at least a 1-2 week rebound)
followed by a drop to a new multi-month low on Wednesday 1st May.
Wednesday's decline took GDX down to its 200-day MA, which we had warned
could happen prior to last week's upward reversal. The following chart
shows that GDX managed to hold this moving average on a daily-closing
basis, but note that both the HUI and the XAU ended the day well below
their own 200-day MAs.
The extension of the gold sector's short-term decline opens up the
possibility that the next rebound will be stronger than the counter-trend
move we were anticipating at the end of last week. However, we expect to
be playing defence with our gold-mining exposure for a while yet rather
than attempting to trade rebounds that in the grand scheme of things will
turn out to be unimpressive.
A development that could spur
something more interesting than 5%-10% bounces in the gold-mining indices
and ETFs is a downward reversal in the Dollar Index (DX). To generate
preliminary evidence of such a reversal the DX would have to close below
97.
The Currency Market
At the conclusion
of the FOMC meeting on Wednesday 1st May the Fed issued its updated
comments about monetary policy and the economy. There were no significant
changes in the Fed's planned actions or words, but, strangely, the market
reaction suggested that a significant number of traders were anticipating
a further shift by the Fed into 'dovish territory', that is, a further
shift towards a monetary easing bias. We say "strangely" because it isn't
possible for the Fed to become more 'dovish' without a plausible pretext,
such as a plunging stock market and/or signs that a banking crisis is
brewing. With the senior US stock indices near all-time highs, the Fed is
already as easy as it can be.
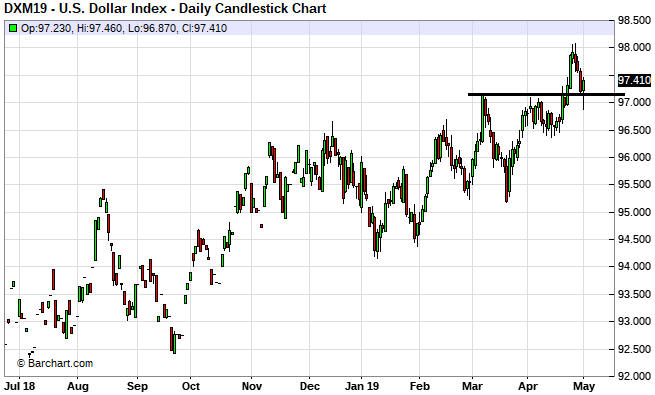
Anticipation that the Fed was about
to become even more 'dovish' is evident in the performance of the Dollar
Index (DX) before the Fed's post-meeting announcement. As illustrated by
the following daily chart, over the first 2 days of this trading week the
June-2019 DX futures contract pulled back to test last week's upside
breakout (it ended Tuesday's session right at the breakout level). It then
traded below the breakout level on Wednesday prior to the Fed's
announcement, potentially setting the stage for a bearish signal in the
form of a failed upside breakout. At this stage, however, last week's
breakout has held.
The price action over the final two days of this
week will be interesting, as the POTENTIAL for a failed upside breakout in
the DX still exists.
Updates on Stock Selections
Notes: 1) To review the complete list of current TSI stock selections, logon at
http://www.speculative-investor.com/new/market_logon.asp
and then click on "Stock Selections" in the menu. When at the Stock
Selections page, click on a stock's symbol to bring-up an archive of
our comments on the stock in question. 2) The Small Stock Watch List is
located at http://www.speculative-investor.com/new/smallstockwatch.html
![]() Kidman
Resources (KDR.AX) is not in the TSI Stocks List, but in several
TSI commentaries over the past year we have described it as a good way to
gain exposure to lithium.
Kidman
Resources (KDR.AX) is not in the TSI Stocks List, but in several
TSI commentaries over the past year we have described it as a good way to
gain exposure to lithium.
It was announced earlier today that KDR
has received a cash takeover bid from Wesfarmers (a large Australian
conglomerate) at a premium of about 50% to the preceding day's closing
price. This is very good news for KDR shareholders.
There is a
realistic possibility of a higher bid, so shareholders who have no
immediate need for additional cash probably should hold for now.
Chart Sources
Charts appearing in today's commentary
are courtesy of:
https://stockcharts.com/
https://www.barchart.com/
![]()