|
- Interim Update 1st September 2010
Copyright
Reminder
The commentaries that appear at TSI
may not be distributed, in full or in part, without our written permission.
In particular, please note that the posting of extracts from TSI commentaries
at other web sites or providing links to TSI commentaries at other web
sites (for example, at discussion boards) without our written permission
is prohibited.
We reserve the right to immediately
terminate the subscription of any TSI subscriber who distributes the TSI
commentaries without our written permission.
Inflating the government debt bubble
In his latest Credit Bubble Bulletin, Doug Noland wrote:
"The U.S. housing mania
was historic - and it's over. Mortgage Credit will not provide a
meaningful source of system Credit expansion for some years to come.
This post-Bubble reality is misdiagnosed as "deflation." As we've
already witnessed, even enormous fiscal and monetary stimulus does
little to incite mortgage borrowing. Just as post-tech Bubble reflation
bypassed the technology sector in favor of inflating mortgage Credit,
the MBS marketplace, and housing prices, today's reflationary forces
flow vigorously to government (and related) debt markets."
Rising demand for government debt is often considered to be driven by
fear of deflation and/or economic weakness, but Noland makes a good
point that in the current environment it could well be an effect of
inflation.
It's amazing that so few people understand how increases in the money
supply affect prices. It's amazing because the basic relationship
between monetary inflation and prices was identified almost 300 years
ago by Richard Cantillon (an Irishman with a Spanish name who lived
most of his life in France), and because the complete theory behind the
money-price relationship was developed almost 100 years ago by Ludwig
von Mises. The main point that needs to be understood is that monetary
inflation does not have a uniform effect on prices; rather, it affects
different prices in different ways at different times, and confers a
benefit to the early receivers of the new money at the expense of the
later receivers*.
Unfortunately, the vast majority of economists and financial market
analysts appear incapable of seeing inflation at work as long as an
index of consumer prices is fairly stable. For example, there has been
massive inflation in the US economy over the past 20 years, but
throughout this period hardly anyone in the economics profession
perceived an inflation problem because instead of fueling large gains
in consumer prices, the inflation fueled bubbles in the stock market,
tech/telecom/internet-related investments, real estate, debt
securitisation and mortgage finance.
Now there are preliminary signs of a bubble in government debt. And
just as the real estate and mortgage finance bubbles were the result of
deliberate policies designed to mitigate the bursting of the
tech/telecom/internet bubble, the government debt bubble is
deliberately being inflated in a breathtakingly moronic attempt to
mitigate the bursting of the real estate and mortgage finance bubbles.
*Refer to http://www.economictheories.org/2008/08/effect-of-changes-in-money.html for additional explanation
The Stock Market
Sometimes
a failure to break out can be just as informative as a breakout. A good
example is the recent failure -- noted in last week's Interim Update --
of the US Home Construction Index (DJUSHB) to break below support at
220, despite a very bearish news backdrop. At this stage the DJUSHB has
done no more than bounce back to its declining 50-day moving average
(refer to the following chart for details), but because it represents
the US stock market's weakest link it needs to break down in the near
future to keep alive the possibility that new multi-month lows lie
ahead for the broad market. On the other hand, if the weakest link
doesn't break then neither will the chain.
Like the Home
Construction Index, the S&P500 Index (SPX) has held important
support for now (see chart below) and has bounced back to its 50-day
moving average.
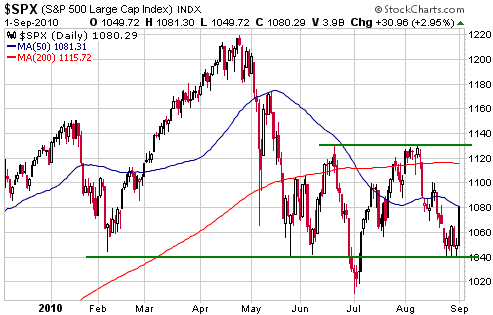
Since the beginning
of the year the SPX has been tracking the Presidential Cycle Model,
which points to an early-October low followed by a strong multi-month
rally. Based on this Model, as well as on long-term cycles and our
expectation that US economic data would take a turn for the worse
during the second half of the year, we have been expecting a decline to
an October low and have previously mentioned the mid-900s as a likely
downside target for the SPX. There isn't sufficient evidence to rule
out this scenario, but the following positives should be taken into
account:
1. Last week, the AAII sentiment survey reported the lowest percentage
of bulls since March-2009. This week, the Investors Intelligence
sentiment survey reported the lowest percentage of bulls and the lowest
bull/bear ratio since March-2009. This means that we have a positive
divergence between sentiment and price action (sentiment is
disproportionately bearish).
2. The change in silver's chart pattern from precarious to constructive.
3. Relative strength in 'growth proxies' such as base metals, emerging markets, and the Hong Kong stock market.
4. Bad news on the US economy was expected to be one of the drivers of the decline to an October low, but the ISM Manufacturing Report
released on 1st September showed that manufacturing businesses are
generally still doing OK. It will be interesting to see how the stock
market reacts to the monthly employment report due to be released on
Friday, but we don't think the market is as vulnerable to bad news on
the employment front as it is to bad news on the manufacturing front.
The reason is that most people already know that the employment
situation stinks.
The possibility of a decline to an October low is still alive, and we
hope that it eventuates because it would create a great opportunity to
'go long' for a trade. However, the short-term risk/reward is no longer
skewed towards risk. We are therefore upgrading our short-term stock
market outlook from "bearish" to "neutral".
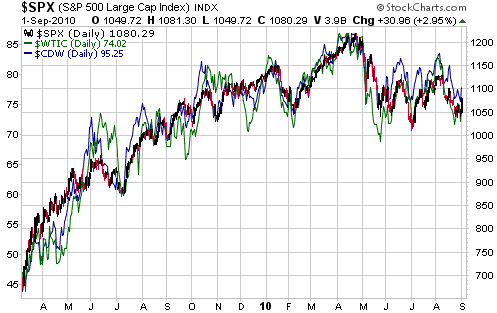
On the following daily SPX chart we have overlaid charts of the
Canadian Dollar (the blue line) and oil (the green line). Our purpose
is to illustrate the strong positive correlation between these three
different markets.
From a fundamental perspective, the incredibly tight relationship
between these different markets makes no sense. It suggests that
trading is being dominated by "black box" systems that are programmed
to buy/sell one market based solely on the movement of another market.
Due to the strong correlation illustrated below, the change in our
short-term stock market outlook requires changes in our short-term
outlooks for industrial commodities and the US$. With the exception of
our bearish view on bonds and our new bullish view on gold stocks
(discussed below), on a short-term basis we are now "neutral" across
the board.
Gold and
the Dollar
Gold
Gold edged a little higher over the first three days of this week, so
not much has changed since we wrote the latest Weekly Update. It
obviously wouldn't take a lot of additional buying pressure to push the
US$ gold price to a new all-time high, but a pullback is the more
likely near-term outcome.
Traders should consider buying a pullback to the 50-day moving average (currently at $1214 in the December futures).
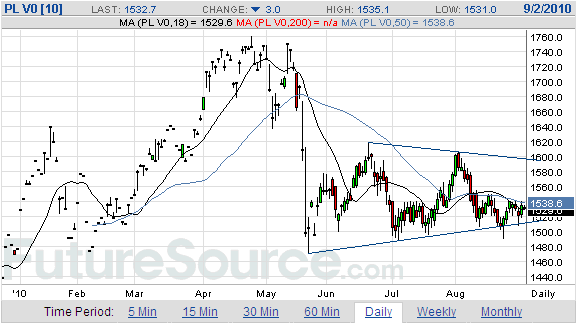
At this time,
platinum is the weakest link in the precious metals sector. And as is
the case with the broad US stock market, the weakest link in the PMs is
managing to hold above support for now.
A downside breakout by platinum won't necessarily mean that significant
downside lies in store for gold and silver, but if there is going to be
significant downside in gold and silver there should first be a
downside breakout by platinum.
We are still holding
the put options on silver and silver stocks that were bought as
protection against the risk of a sharp decline to an October low, but
will look for an opportunity to exit these puts over the days ahead. We
will probably exit this 'insurance' position if the gold price drops
below $1220 and/or the silver price pulls back to around $18.60 in the
near future.
Gold Stocks
Current Market Situation
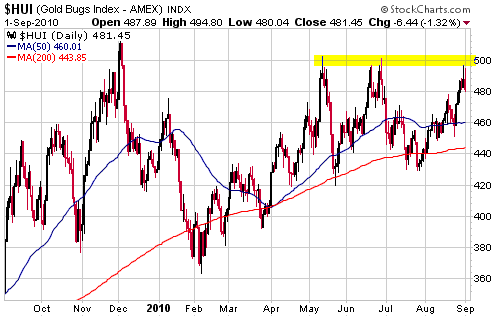
In the latest Weekly Update we wrote that if the HUI were to test
resistance at 495-505 over the coming days then we would take it as
confirmation that a new intermediate-term advance had begun. The reason
is that although a quick rise to 495-505 would leave the HUI
'overbought' and potentially at some sort of top, it would effectively
be a 'triple top' and would therefore likely lead to an upside breakout
at some point over the ensuing few weeks.
The following chart shows that the HUI rose to the bottom of the
aforementioned resistance range earlier this week and then reversed
lower, thus creating a 'triple top' that will likely be breached within
the next three weeks.
One piece of the
puzzle that hasn't yet fallen into place is illustrated by the
following chart. The chart shows that the HUI/gold ratio remains below
its May peak.
If the HUI has commenced an intermediate-term advance then it should
soon be confirmed by a rise to a new 6-month high by the HUI/gold ratio.
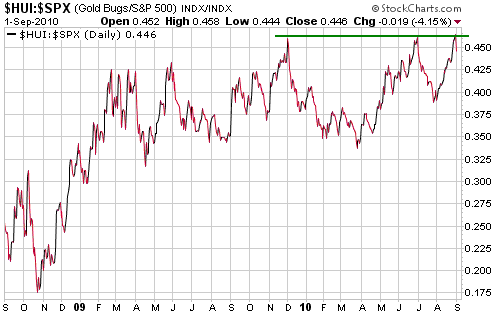
The next chart shows
that the HUI just became as extended to the upside, relative to the
broad stock market, as it was in early December and late June. The
HUI/SPX ratio should ultimately move much higher, but the recent gains
might first have to be consolidated.
If a new upward trend
has begun (as now seems likely) then any near-term pullback in the HUI
will probably end at, or above, the 50-day moving average (460). Going
the other way, the measured objective following a solid break above 500
would be 630. Clearly, the short-term risk/reward is now decidedly
"bullish" if we are right to interpret the recent price action as
indicative of an emerging upward trend. We are therefore upgrading our
short-term HUI outlook accordingly, but will use a daily close below
450 as a 'stop'.
Speculators who don't want to take on the hassle and risk associated
with individual gold stocks should accumulate GDX (seniors and
mid-tiers) and/or GDXJ (mid-tiers and relatively large juniors) during
pullbacks. We are most bullish on small-scale juniors, but,
unfortunately, there isn't an ETF that focuses on this type of stock.
The Juniors
Speculation within the ranks of junior gold/silver stocks is not yet
broad-based, but it is definitely broadening. Over the past couple of
months the juniors have started to get full value in the stock market
for positive news on the exploration front, and now we are seeing some
lengthy consolidation patterns ending, or seemingly getting ready to
end, via upside breakouts.
Something to bear in mind when speculating in junior resource shares is
that the shares of an individual junior should be bought/sold based on
your assessment of that stock's risk/reward, not based on your
assessment of the gold sector's risk/reward. To put it another way: you
shouldn't buy the shares of a particular gold junior just because you
think the HUI is headed upward and you shouldn't sell the shares of a
particular gold junior just because you think the HUI is headed
downward. Such buy/sell decisions should, instead, be based solely on
the merits of the individual stock in question, while changes in
sector-wide risk should be managed by adjusting the cash percentage of
the overall portfolio and/or purchasing insurance in the form of put
options.
The reason that buy/sell decisions for individual juniors should be
based solely on stock-specific considerations is that juniors often
don't trade in line with the indices; rather, it is common for them to
either dramatically under-perform or outperform the indices in response
to company-specific issues. For example, the HUI reached a 52-week high
of 510 on 2nd December 2009 and is therefore currently down by around
6% from its high. Over the same period, Sabina Gold and Silver is up
200%, Orvana Minerals is up 80%, Golden Queen Mining is up 35%, and
Copper Fox Metals is up 235%. There are, of course, plenty of junior
metal stocks that are down by significant amounts over the period in
question, but the point is that large divergences regularly develop
between individual juniors and the market sector to which they belong.
Currency Market Update
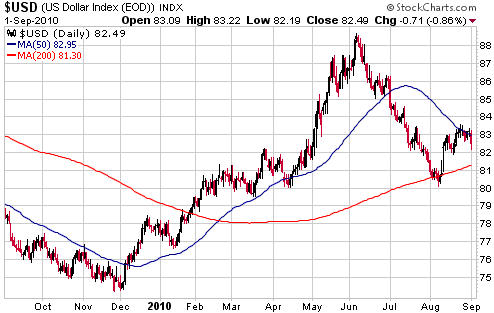
The US dollar's initial rebound from its early-August low appears to
have ended at the 50-day moving average, which is not bullish price
action. The odds of the Dollar Index making a new 52-week high during
the final quarter of this year have lengthened.
Update
on Stock Selections
(Notes: 1) To review the complete list of current TSI stock selections, logon at http://www.speculative-investor.com/new/market_logon.asp
and then click on "Stock Selections" in the menu. When at the Stock
Selections page, click on a stock's symbol to bring-up an archive of
our comments on the stock in question. 2) The Small Stock Watch List is
located at http://www.speculative-investor.com/new/smallstockwatch.html)
 Jaguar Mining (NYSE and TSX: JAG). Shares: 84M issued, 88M fully diluted. Recent price: US$6.15 Jaguar Mining (NYSE and TSX: JAG). Shares: 84M issued, 88M fully diluted. Recent price: US$6.15
We added Brazil-based gold producer JAG to the TSI Stocks List via the
email sent to subscribers earlier this week (the email is archived at http://www.speculative-investor.com/new/stockemail.asp).
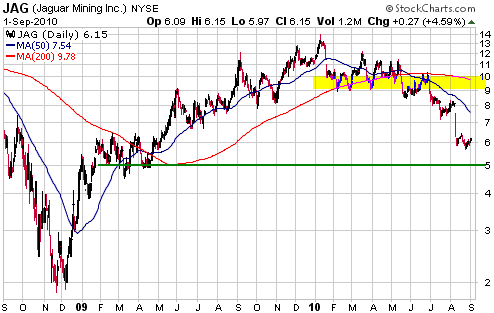
Here is the price chart. Support at US$5.00 probably defines the
short-term downside risk, while any rally over the next few months will
likely be capped by resistance at US$9-$10 (unless the gold market
takes off).
 Clifton Star Resources (TSXV: CFO). Shares: 28M issued, 38M fully diluted. Recent price: C$4.10 Clifton Star Resources (TSXV: CFO). Shares: 28M issued, 38M fully diluted. Recent price: C$4.10
CFO has been a source of frustration over the past few months, due
mainly to the way its JV partner (Osisko) has been reporting the
progress of the massive drilling program underway at CFO's Duparquet
project in Quebec. For one, Osisko has been slow to report the results
of drilling. For another, Osisko has been using a blanket approach to
the drilling that will eventually lead to a very complete understanding
of the gold deposit and, quite likely, a very large estimated resource,
but also yields a greater proportion of uninteresting results than
would a more targeted drilling strategy.
The combination of the elevated growth expectations that were built
into CFO's stock price by late February (when we suggested taking
partial profits) and Osisko's approach to the drilling over the past
several months led to a substantial downward correction. For two main
reasons, we suspect that this correction is over and that the stock's
next intermediate-term advance will soon begin. First, the stock market
has started to pay attention to drilling news and to reward junior
gold/silver companies that announce positive results. Second, the price
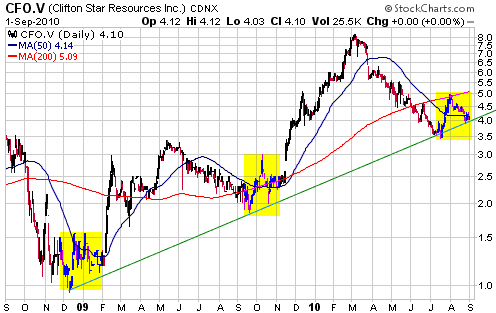
action since the July bottom looks similar to the price action
following the intermediate-term corrections that ended in December-2008
and September-2009 (refer to the below chart for further information).
Some of our favourite exploration-stage juniors didn't 'correct' by as
much as we'd hoped over the Northern Hemisphere summer months (we had
hoped to feature them as candidates for new buying at significantly
lower prices), which is fine for speculators with plenty of exposure
but not so fine for speculators with minimal exposure. CFO is one of
the few that has dropped back by as much or more than anticipated, but
not because there has been deterioration in its fundamental value. As
far as we are concerned, the back-of-the-envelope valuation-based
target of C$13/share mentioned in the 22nd February 2010 Weekly Update
still applies.
A word of caution: CFO is an illiquid stock, which can make it difficult to trade.
 Orvana Minerals (TSX: ORV). Shares: 115M issued, 119M fully diluted. Recent price: C$1.94 Orvana Minerals (TSX: ORV). Shares: 115M issued, 119M fully diluted. Recent price: C$1.94
At the current gold price, we think that ORV has valuation-related
upside potential of 50%-100%. However, the stock's near-vertical rise
has created a short-term selling opportunity (an opportunity to take
PARTIAL profits).
We like to trade around long-term core positions. This trading involves
scaling in during the purges and scaling out during the surges.
Chart Sources
Charts appearing in today's commentary
are courtesy of:
http://stockcharts.com/index.html
http://www.futuresource.com/
|

