![]()
![]()
![]()
![]()
- Interim Update 1st November 2017
Copyright
Reminder
The commentaries that appear at TSI
may not be distributed, in full or in part, without our written permission.
In particular, please note that the posting of extracts from TSI commentaries
at other web sites or providing links to TSI commentaries at other web
sites (for example, at discussion boards) without our written permission
is prohibited.
We reserve the right to immediately
terminate the subscription of any TSI subscriber who distributes the TSI
commentaries without our written permission.
US Recession Watch
We pay close attention to three
leading indicators of US recession: Real Gross Private Domestic Investment
(RGPDI), the US yield curve and the ISM Manufacturing New Orders Index
(NOI). Here's what these indicators were telling us a month ago (as stated
in the 4th October Interim Update):
"With none of the leading
indicators we care about currently warning of recession and with the NOI
having just risen to the top of its 10-year range, the probability of a US
recession beginning in 2017 is now approximately zero. Given the
tightening of monetary conditions it is possible that a recession will
begin as soon as the first quarter of 2018, but it's more likely that
there will be no recession until Q2-2018 or later."
It's time
for an update, because the latest iteration of quarterly RGPDI was
reported last Friday (27th October) and the latest iteration of the
monthly NOI was reported on Wednesday 1st November.
The first of
the following charts shows that RGPDI made a new high in the third quarter
of this year. This suggests that the start of the next recession is at
least two quarters away. Note: The vertical red lines on the chart
indicate the official starting times of the last two recessions. The
second of the following charts shows that although the ISM NOI dipped a
little in October it remains very close to the top of its 10-year range
and far above the level it would have to fall below (the red line on the
chart) to warn of a recession. Lastly, we note that the yield curve
remains in a 'flattening' trend. This indicates that the
monetary-inflation-fueled boom is intact.
The upshot is that the
situation is essentially unchanged over the past month. The message from
our indicators is that there will be no US recession until Q2-2018 or
later.
Prompted by
commentary that appeared at John Hussman's web site about two years
ago we are adding a fourth member to our group of leading US recession
indicators. The fourth member is the S&P500 Index (SPX) relative to its
12-month moving average.
By itself, the stock market is not a good
recession indicator. This is due to the number of false signals it
generates. Hence the old saying that goes something like "the stock market
has predicted 12 of the last 5 recessions". However, while the stock
market as a leading recession indicator generates plenty of false
positives, it doesn't generate any false negatives. That is, it will
always turn down at or prior to the start of a recession, where turning
down involves a monthly close below the 12-month MA.
Here is a
monthly chart showing the SPX. If a recession warning generated by our
other indicators is valid then it should be confirmed in a timely fashion
by the SPX achieving a monthly close below the blue line on this chart.
The Stock Market
Two weeks ago the Dow
Industrials Index achieved its highest daily RSI(14) since 1980. This
suggested that it wouldn't make significant additional headway before
embarking on a multi-week correction. It was also a sign of strength that
pointed to an extension of the bull market following a correction or
sideways consolidation.
The Dow's closing high to date was on 24th October, when it closed at
23442. On Wednesday 1st November it traded as high as 23518, but closed
slightly below 23442.
Marginal new highs are certainly possible
over the days ahead, but the historical record indicates that the market
should be flat or have a downward bias between now and early December.
Gold and the Dollar
Gold
By
keeping its interest-rate target unchanged and leaving the door open to a
rate hike in December, the Fed did what 'everyone' expected at this week's
FOMC meeting. The currency, bond and gold markets reacted appropriately to
this news on Wednesday 1st November, meaning that the markets that are
most sensitive to the machinations of the Fed did very little. That being
said, the financial markets don't always react appropriately to irrelevant
news or news that should be expected by almost everyone. Therefore,
although it should be treated as irrelevant the US monthly employment news
scheduled for this Friday could be the catalyst for significant gold-price
volatility.
At around this time a month ago we wrote the following
with regard to the employment report scheduled for the coming two days:
"The monthly employment numbers are only ever important to the
extent that they influence the actions of the Fed and it's very unlikely
that the numbers to be reported this Friday will have any influence on the
Fed. The reason is that due to weather-related effects (the hurricanes)
the reported jobs-growth number is widely expected to be low, which means
that a low number will be put down to the hurricanes and will not reduce
the probability of a Fed rate hike in December. On the other hand, the
futures markets have almost fully discounted a Fed rate hike in December,
so there is very little scope for a strong number to increase the
perceived probability of such an outcome."
The jobs-growth
number reported for September turned out to be extremely low (a loss of
about 30K jobs), but predictably the weakness was put down to the
hurricane effect and didn't significantly influence interest-rate
expectations or the gold price. The market reaction was therefore
appropriate.
This time around the jobs-growth number is expected to
be very strong (it could be more than +350K), again due to the statistical
distortions caused by the September hurricanes. A very strong number
therefore shouldn't have a big effect on the gold price. A weak number
should also be taken in stride, because it would be out of synch with most
of the other recent economic data.
However, the gold price is
hovering above an important short-term support level ($1260) at a time
when the speculative net-long position remains substantial and fundamental
support is lacking. Consequently, the market is vulnerable. A break below
$1260 may trigger enough sell stops among leveraged speculators in the
futures market to cause downward acceleration in the price.
With
regard to the next fortnight we perceive downside potential to the
low-$1200s versus upside potential to around $1300. That is, a slightly
bearish near-term risk/reward.
Gold Stocks
Over the first three days of this
week the HUI oscillated between 185 and 190, meaning that not much
happened. This price action has the look of a consolidation prior to an
extension of the short-term downward trend that began in early-September.
Trend-defining resistance lies in the mid-190s. To be more specific, a
daily close above 196 would be evidence that the short-term trend had
changed from down to up.
We are open to the possibility that a
short-term bottom was put in place last week, but it's more likely that
there will be a spike down to 175-180 prior to such a bottom.
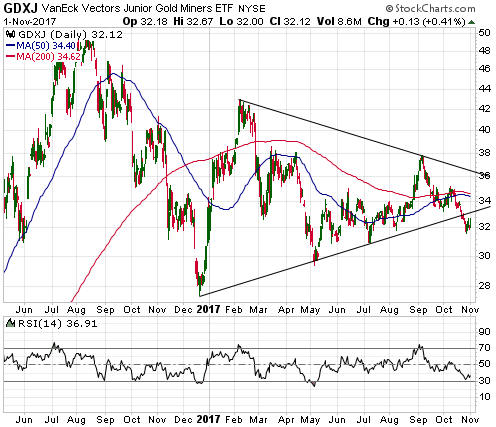
Angled lines drawn on charts are always somewhat arbitrary. They only
ever show one of several ways of interpreting a chart and in most cases
provide no reliable information about the future. For example, we've drawn
lines on the following daily chart of the Junior Gold Miners ETF (GDXJ) to
show a bearish interpretation. The lines we've drawn suggest that
everything from the December-2016 bottom until last week was part of a
correction to an intermediate-term downward trend that began in
August-2016 and that the intermediate-term downward trend has resumed. An
implication is that the December-2016 low will be tested and possibly
breached within the next few months.
We can't say for sure that
this interpretation is wrong, but we think it is too bearish. A different
-- and currently more plausible -- interpretation entails the assumption
that the rally from the December-2016 low was the first leg of a new
upward trend and that everything since the February-2017 peak has been a
correction to this upward trend. Under this scenario GDXJ would likely
find support near the May-2017 low.
The Currency Market
It has been a quiet week
to date in the current market, but Friday's US employment data could
inject a dose of volatility.
Despite the Dollar Index (DX) being
'overbought' its short-term risk/reward still appears to be skewed towards
reward. It could drop as far as the 50-day MA near 93 as part of a normal
correction, but former resistance at 94 should now provide strong support
and could limit the downside over the next few days. On the upside, the
50-week MA near 97 beckons.
Updates on Stock Selections
Notes: 1) To review the complete list of current TSI stock selections, logon at
http://www.speculative-investor.com/new/market_logon.asp
and then click on "Stock Selections" in the menu. When at the Stock
Selections page, click on a stock's symbol to bring-up an archive of
our comments on the stock in question. 2) The Small Stock Watch List is
located at http://www.speculative-investor.com/new/smallstockwatch.html
![]() Blackham
Resources (BLK.AX) published its September quarterly report last
week. We should have covered this news in the latest Weekly Update, but
somehow we missed it.
Blackham
Resources (BLK.AX) published its September quarterly report last
week. We should have covered this news in the latest Weekly Update, but
somehow we missed it.
The company had another sub-standard
production performance during the September quarter. The Wiluna/Matilda
mine was planned to be a 25K-oz/quarter gold producer, but in each of its
first three operating quarters it has managed to produce only 15K-16K
ounces. Production during the latest quarter was 15.6K ounces.
The
next quarter's production result is expected to be better, but then the
next quarter's production result is always expected to be better.
Unfortunately, the weak production result wasn't the only bad news in
BLK's latest quarterly report. The company also pushed out the completion
date for the Expansion FS (the study into the changes that will be made
with the aim of increasing production to 200K-ounces/year).
The
Expansion FS was originally supposed to be finished during the December
quarter of this year, but two months ago its scheduled completion date was
pushed out to March of 2018. It has just been delayed again and is now
expected to be complete in June of 2018.
The most urgent issue for
BLK involves its balance sheet. The company has a negative working-capital
position and a $15M debt repayment due at the end of December. To make
this debt repayment the company had to either arrange a new debt facility
or issue a large quantity of low-priced shares, with the former solution
being vastly superior to the latter.
A press release issued during
Australian trading on Wednesday 1st November confirmed that the preferred
solution (a new debt facility) is happening. More specifically, the
company confirmed that it has a credit-approved term sheet to fully
refinance the A$36.7M current secured debt position. The term sheet has
the first repayment in June 2020, meaning that the company has bought
itself a substantial amount of time and that most of the short-term
financial pressure has been removed.
In other words, some good news
at last from BLK management!
In previous commentaries we wrote that
despite its extremely low valuation BLK would only become a good candidate
for new buying after it shored-up its balance sheet. Thanks to the 1st
November news its balance sheet is now in much better shape.
BLK
has been crushed over the past 8 months (see chart below) and will require
a long time to fully recover even if all goes well from here, but the
first big step on the road to recovery has just been taken. If the new
debt facility is put in place as outlined in this week's press release and
the company is cash-flow positive from this quarter onward then the stock
could be back at A$0.50 by next March. At this price it would still be
well down from its February-2017 high but it would be about 250% above its
current price of A$0.14.
Chart Sources
Charts appearing in today's commentary
are courtesy of:
http://stockcharts.com/index.html
http://bigcharts.marketwatch.com/
![]()