![]()
![]()
![]()
![]()
- Interim Update 2nd March 2016
Copyright
Reminder
The commentaries that appear at TSI
may not be distributed, in full or in part, without our written permission.
In particular, please note that the posting of extracts from TSI commentaries
at other web sites or providing links to TSI commentaries at other web
sites (for example, at discussion boards) without our written permission
is prohibited.
We reserve the right to immediately
terminate the subscription of any TSI subscriber who distributes the TSI
commentaries without our written permission.
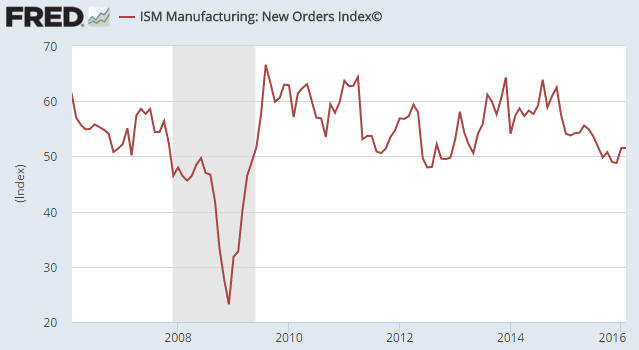
Still no definitive US
recession signal
The ISM Manufacturing New Orders
Index needs to drop below 48 to signal that a recession is about to begin in the
US. The index was 49.0 in November, 48.8 in December and 51.5 in January. It
therefore came close to signaling a recession during November-January, but
didn't quite manage to do so. The February number was reported on Tuesday of
this week and is the same as the January number (51.5).
It is therefore still the case that the ISM New Orders Index, the most reliable
leading indicator of US recession within the ranks of monthly economic
statistics, has not yet generated a definitive recession warning.
The situation is shown below. Just as it did in the third quarter of 2012, over
the past few months the national Manufacturing New Orders Index rebounded from
'the brink'. However, the position of this indicator remains precarious.
Monetary Inflation
Update
The US True Money Supply (TMS)
had remarkably stable growth from late 2013 through to the end of 2015. The
money supply itself wasn't stable, but the growth rate spent more than two years
oscillating within an unusually narrow range -- from 7% to 8% -- due to the
winding-down of the Fed's money-creation program being almost exactly offset by
the ramping-up of commercial bank money creation. However, the following chart
shows that in January of this year the monetary inflation rate dipped below the
bottom of its narrow 2-year range. This is important if it points to the start
of a trend, because monetary inflation has been the main factor propping up the
stock market, the real estate market and the GDP numbers over the past few
years.
We refer to the combination of the US and euro-zone money supplies as "G2 TMS".
The G2 money supply had strong growth from late-2014 through to late last year
thanks to aggressive money-pumping by the ECB, but the following chart shows
that over the most recent two months its growth rate has plunged from 10.3% to
8.3%. A growth rate of 8.3% is still high by long-term historical standards,
but, as with the US monetary inflation rate, the recent decline will turn out to
be important if it indicates a new trend.
Rapid monetary inflation causes problems that are revealed for all to see after
the pace of money creation tapers off. Based on what happened over the past 20
years, a decline in the G2 TMS growth rate to below 6% would reveal the problems
and likely bring on a financial crisis.
At the same time as monetary inflation has started to become less supportive of
asset prices and nominal GDP numbers in the US and to a lesser extent the
euro-zone, it has started to become more supportive in China. As illustrated
below, the year-over-year rate of growth in China's M1 money supply has risen
sharply over the past few months from near an all-time low to its highest level
since late-2010. This is due to ramped-up credit expansion by Chinese banks at
the behest of the government. The thinking appears to be that the best way to
deal with a burgeoning pool of non-performing loans in the banking system is to
'encourage' the banks to lend more aggressively.
Last up we have a chart showing the UK's monetary inflation rate. A comparison
of this chart with the US monetary inflation chart above tells us that the
British Pound's recent large decline (relative to the US$) to near its lows of
the past 20 years had nothing to do with the supply side of the equation. Since
2009, the UK has consistently had a slower monetary inflation rate than the US.
We can therefore be sure that the Pound's recent weakness is demand driven. It
is probably due mostly to uncertainty created by the referendum on EU membership
scheduled to happen in the UK on 23rd June.
Why NIRP won't happen
in the US
The Fed has begun to mention
NIRP (Negative Interest Rate Policy) as an option that could be considered in
the future, and many analysts are now assuming that the Fed will eventually
follow the ECB down the NIRP path. We don't think it will happen. While there is
plenty of evidence that the senior members of the Fed have a poor understanding
of how money-pumping and interest-rate manipulation affect the economy, we don't
think they will go as far as implementing NIRP. The main reason is the direct
cost of NIRP for US commercial banks.
Something that needs to be understood here is that the banking system as a whole
cannot reduce its reserves. An individual bank can reduce its reserves, but only
by shifting reserves to another bank. It is only the Fed that is capable of
creating and destroying reserves. Consequently, if the Fed were to start
charging banks a fee (a negative interest rate) for the reserves held by the
banks in accounts at the Fed, there is nothing the banking system could do to
avoid the cost. In particular, the banking system as a whole could not avoid the
cost by making more loans, so charging banks for their reserves would not create
an incentive for banks to collectively expand credit.
What, then, would be the point of imposing this cost on banks? To put it another
way, given that the Fed is solely responsible for adding more than $2T to bank
reserves over the past several years, what could it possibly hope to gain by now
levying a charge on those reserves?
A possible retort is that the ECB has been charging euro-zone banks for their
reserves and has all but promised to increase the charge. Yes, but look at how
that's working! Financially-stressed banks in the euro-zone are becoming even
more stressed. This indicates to us that Mario Draghi could be the most stupid
person to ever head up a major central bank. Under the guise of helping the
banking system he is unwittingly destroying it.
Regardless of what has recently been said, the Fed probably won't make such an
obvious mistake. If nothing else, Goldman Sachs, JP Morgan and other large US
banks will stop it from doing so.
Natural Gas
Lithium
Almost all commodity markets are in the doldrums. Gold is one exception due to
its safe-haven status. Lithium is another exception due to the
increasingly-popular view that a large increase in the production of electric
cars over the years ahead will lead to a large increase in the demand for
lithium, which is used in the batteries that power the cars. Refer to the
article posted
HERE for an overview of the budding lithium mania.
The surge in the price of lithium and the belief that the upward trend will
continue has led to the usual scramble -- the sort of thing that always happens
when the price of a mineral takes off -- by junior mining companies for
lithium-related projects. The percentage of these companies that end up making
money from the actual mining of lithium will be close to zero, but spectacular
run-ups in stock prices could occur in response to slick promotion and
uninformed speculation.
At this stage we won't try to pick winners in the lithium space, but there is
currently some accidental exposure to lithium in the TSI
Small
Stocks Watch List. We are referring to Nevada Sunrise Gold (NEV.V), which is
of interest to us due to its 21% stake in the Kinsley Mountain gold project
being explored by Pilot Gold.
We aren't happy that NEV has been investing its very limited financial resources
in early-stage lithium projects (and said as much in the 9th November 2015
Weekly Update), but the decision by NEV's management to jump onto the lithium
bandwagon could give the share price a substantial boost before this year is
over. That's regardless of whether or not these early-stage projects have
genuine potential to host economic deposits.
Natural Gas
Natural Gas is worth mentioning today simply because its price in the US has
just fallen to near a 20-year low (the 2nd March close was the lowest close
since 1999). Some NG producers would still be profitable thanks to forward sales
done at much higher prices, but very few NG producers would be able to make
money at the current spot price. This should mean that a major price bottom is
near, especially considering that the oil price has almost done enough to signal
an intermediate-term bottom.
The Stock Market
The US
TSI readers shouldn't have been surprised by this week's extension of the US
stock market's rally, as it's exactly in line with what we described as the most
likely near-term outcome. The question remains as to whether the rally in the
S&P500 Index (SPX) will end near the important lateral resistance that lies at
1990-2000, which is now in the process of being tested, or extend to a higher
level.
It's certainly possible that the rally will end near 1990-2000, but we continue
to view the 200-day MA in the 2020s as the most likely price area for the next
short-term peak. Be aware, though, that the rally could continue to as high as
lateral resistance at 2075 and still be part of a gradually-unfolding bear
market.
The following chart shows the NASDAQ Composite Index and the NASDAQ's McClellan
Oscillator (MO).
The NASDAQ's MO was at an 'oversold' extreme at the NASDAQ's 20th January price
low and then made a higher low during the first half of February in parallel
with a lower low for the NASDAQ itself. We highlighted this positive divergence
in the Interim Update that was published on 11th February -- the day of the
ultimate price low.
The NASDAQ's MO has since surged to an 'overbought' extreme. In fact, at the end
of Wednesday's trading session the MO was at one of its highest readings of the
past 15 years.
Now, according to the historical record the MO's current 'overbought' extreme
does not have short-term bearish implications. Past performance actually
suggests that the NASDAQ will either have an upward bias or move sideways over
the next few weeks. If anything, it is a reason that speculators looking for
opportunities to establish bearish US stock market positions should be patient.
In the world of practical speculation there is never a need, or even a good
reason, to attempt to pick price tops and bottoms. Instead, a realistic approach
involves averaging into a position when the risk/reward appears to be decisively
supportive of the position. That's why we think that it is almost time to START
averaging into a new US stock market bearish position at the same time as we
suspect that the market will do no worse than trade sideways over the next few
weeks.
The specific bearish position we've chosen to track at TSI is the QID July-2016
$40 call option. QID is a leveraged fund that moves in the opposite direction to
the NASDAQ100 (NDX), so a QID call option would benefit from a decline in the
NDX.
The above-mentioned QID call option will be added to the TSI List if it trades
at US$1.50 (it closed at $1.57 on 2nd March). If the market continues to work
its way higher over the next few weeks without invalidating the bear-market
scenario then we'll probably add a second bearish position.
By the way, a bearish stock-market option position meshes with the bearish
bond-market option position added to the TSI List in the latest Weekly Update,
because under most of the plausible 2-6 month scenarios at least one of these
positions will perform very well.
Gold and the Dollar
Gold
When people draw angled lines on charts they are presenting an opinion, not a
fact. They are effectively saying "this is my interpretation of the price
pattern and a guess as to what this interpretation implies about the future." At
the same time, others will be interpreting the pattern differently or coming up
with the same interpretation of the pattern along with a completely different
guess as to what it implies about the future.
Gold's price action since its 11th February peak illustrates the point we are
trying to make. This price action could be interpreted as a contracting
triangle, which, in turn, could be interpreted as either a consolidation within
an on-going short-term upward trend or a topping pattern. The price action could
also be interpreted as a sharp decline from the peak followed by a slow, choppy
advance to a secondary peak. This interpretation is supported by the fact that
it has taken the gold market 11 trading days to recoup the single-day loss of
16th February.
The correct interpretation will only be known with the benefit of hindsight. In
the meantime it is reasonable to speculate based on an opinion as to what the
pattern is and what it implies about the future, provided that you regularly
check your opinion against the price action.
Our guess is that gold's price action since 11th February is part of a
short-term topping pattern, but we haven't made any bets that are predicated on
this guess* and readily acknowledge that a top hasn't yet been signaled. In
other words, we readily acknowledge that a surge to a new high for the year
could happen within the next several days.
A short-term top would be signaled by a daily close below the 20-day MA. This MA
is now at $1211 and should be above $1220 by the end of the week.
By the way, if you look at the following daily gold chart you'll see that the
50-day MA (the blue line) has just moved from below to above the 200-day MA (the
red line). This type of MA crossover will often coincide with a short-term top.
That is, this type of MA crossover will often -- but certainly not always --
have short-term bearish implications.
*What we have done is mitigate the risk that a top is in
place by raising cash and purchasing some insurance in the form of put options.
Gold Stocks
The HUI has been a lot stronger than gold since its January bottom and has made
new highs for the year since gold's 11th February peak. The dramatic strength in
the HUI relative to gold over the past several weeks has bullish
intermediate-term implications for both gold and the gold-mining sector, but it
doesn't imply that additional short-term gains are likely.
Although the HUI made a new high for the year as recently as last week, its
current position is not markedly different from gold's. Its 50-day MA has just
crossed from below to above its 200-day MA and it could be topping on a
short-term basis, but it hasn't yet signaled a top.
Regardless of whether it has already begun or begins after a surge to a new high
for the year, the coming correction in the gold-mining sector will probably
continue until the HUI has reached its 50-day MA. The 50-day MA is now at 130
and is rising at the rate of about 5 points per week.
The main reason that the gold-mining indices have been able to extend their
advances following gold's 11th February peak is illustrated by the chart
displayed below. The chart shows that non-gold mining stocks, as represented by
the Diversified Metals and Mining Index (SPTMN), have rocketed upward over the
past three weeks.
The Currency Market
We mentioned earlier in today's report that the British Pound has recently
fallen to near a 20-year low relative to the US$. Here's the relevant chart,
which shows that apart from brief periods in 2001 and 2009 the Pound traded
lower during the first half of this week than at any time over the past two
decades.
Given that the Pound has been inflated to a lesser extent than the US$ over the
past several years, this currency's present level probably constitutes a
long-term buying opportunity.
Updates on Stock Selections
Notes: 1) To review the complete list of current TSI stock selections, logon at
http://www.speculative-investor.com/new/market_logon.asp
and then click on "Stock Selections" in the menu. When at the Stock
Selections page, click on a stock's symbol to bring-up an archive of
our comments on the stock in question. 2) The Small Stock Watch List is
located at http://www.speculative-investor.com/new/smallstockwatch.html
Chart Sources
Charts appearing in today's commentary
are courtesy of:
http://stockcharts.com/index.html
http://research.stlouisfed.org/
![]()