|
- Interim Update 2nd July 2003
The US
Stock Market
Taking Stock
Over the past several weeks we've discussed
some of the things we expect to see in the early stages of the next major
decline in the stock market. Here's a recap on some of these early warning
signals.
1. We won't include a chart of the
NDX/Dow ratio in today's commentary, but as noted many times over the past
6 months we expect the early stages of the next major decline in the stock
market to be characterised by persistent weakness in the NASDAQ100 Index
relative to the Dow Industrials Index. This has been the case with every
substantial decline over the past few years and we don't see why it won't
be the case in the future. The NDX/Dow ratio achieved a new closing high
on Wednesday, so this indicator is NOT signaling that a major decline has
begun.
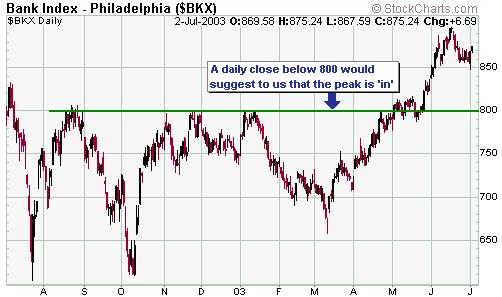
2. Bank stocks have been leaders in
the rally that began last October and the performance of the banking sector
often indicates the underlying health of both the market and the economy.
If a pullback in the Bank Index (BKX) is a correction within a continuing
uptrend, as opposed to the start of a new major downtrend, it should hold
above 800.
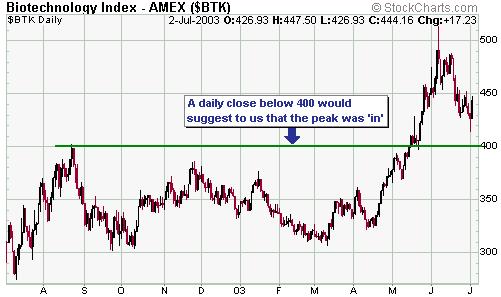
3. The Biotechnology Index (BTK) was
one of the first indices to bottom last year. Given its price action over
the past month it is also likely to be one of the first indices to break
below important support and thus provide an early warning signal that a
major decline in the overall market is underway.
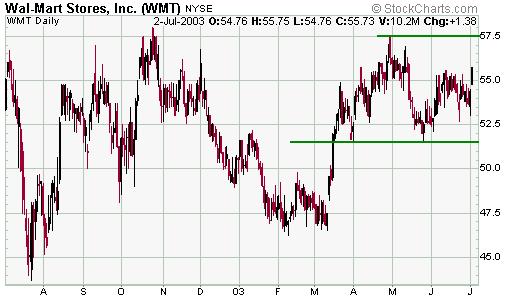
4. The Walmart (WMT) stock price has
tended to lead the S&P500 Index over the past year and may have done
so again when it peaked in late April about 7 weeks prior to the peak in
the S&P500. However, having made a lower high WMT now needs to make
a lower low (by closing below $51.50) to confirm that an intermediate-term
downtrend is in effect. If this happened it would indicate to us that an
important peak was already in place for the S&P500. Conversely, if
WMT were able to close above its April high it would suggest that the S&P500
was at least 6 weeks away from a peak.
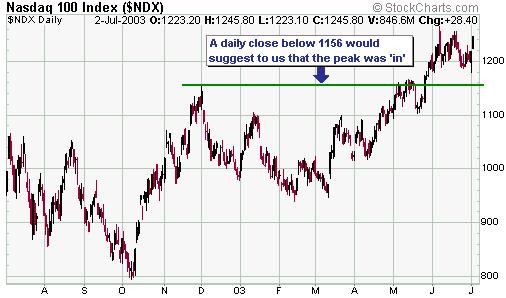
5. A normal correction in the NASDAQ100
Index at this stage should hold above support at 1156.
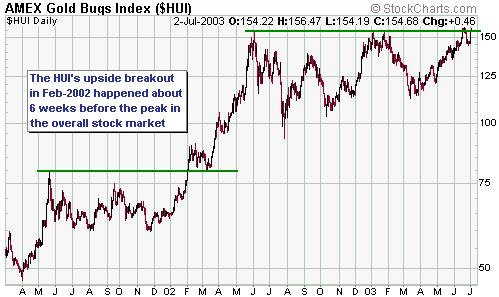
6. If the overall stock market were
close to a peak we would expect to see strength in the gold sector. This
is, in fact, what we have seen over the past few months and, in particular,
since the beginning of May. Notice, on the below chart, how the AMEX Gold
BUGS Index (HUI) broke out to the upside in February of 2002. This upside
breakout occurred about 6 weeks prior to a peak in the Dow Industrials
Index
and represented a warning that the rebound in the overall stock market
from its September-2001 bottom was almost over. As such, when the HUI moves
decisively above the 'triple top' created over the past 13 months (triple
tops almost never hold) it won't necessarily be a sign that a major decline
has begun in the overall market. It will, however, be a sign that a peak
is close at hand.
Current Market Situation
Sentiment has reached levels that are
consistent with what we'd expect to see near a major peak. Also, there
have been signs of distribution over the past 2-3 months. For example,
insiders have been selling stock at a rapid rate and Investors' Intelligence
reports that there were more than 100 buying climaxes on the NYSE in 10
out of the past 12 weeks (a buying climax occurs when a stock makes a new
52-week high and then closes down on the week). However, there is scant
evidence at this stage that a major decline has already begun.
It will be informative to observe how
the market behaves over the next 2 weeks. As discussed in the latest Weekly
Update, this week was likely to see some strength in the market due to
seasonal factors. Beginning next week, though, we'll find out how much
real strength there is.
Bonds
Japanese Government Bonds (JGBs) have
fallen sharply over the past month and at the close of trading on Wednesday
JGB futures were poised right at intermediate-term support (refer to the
below weekly chart). This could be just a sharp pullback within a continuing
bull market, but if support at 141 is decisively breached then the probability
that a major peak is already in place will increase substantially.
As discussed in the 23rd June Weekly
Update, from a cyclical perspective the most likely time for a major low
in US bond yields (a major high in US bond prices) is October of this year.
However, if the JGBs have peaked then there isn't much chance that US bonds
will exceed last month's high. As such, we will consider a weekly close
below 141 in the JGB futures to be a clear sign that a major peak for US
bonds is behind us.
On a slightly different topic, we will
need to see how bonds behave in parallel with significant stock market
weakness to know whether the inverse relationship between stocks and bonds
that has characterised the past 5 years is still in effect. Over the past
3 months we've seen stocks and bonds rally in parallel, but we are yet
to see any meaningful concurrent declines.
Gold and
the Dollar
Currency Market Update
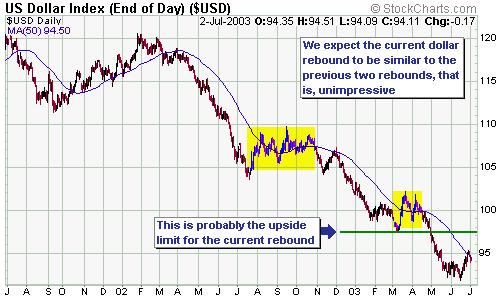
We expect the Dollar's rebound to continue
over the next month or so, but as discussed in recent commentaries we don't
think the upside potential is great. In fact, in all likelihood the current
rebound will be similar in magnitude to the rebounds that occurred during
July-October of last year and March-April of this year. This means that
the Dollar probably has about 2-3% of upside potential from yesterday's
closing level.
Below is a chart of the Yen covering
the past 3 years. The Yen has major resistance at around 86-87 and every
time it approaches this resistance the Bank of Japan jumps into the market
and buys enough dollars to ensure that a breakout does not occur. It is
always dangerous to bet against the ability of any central bank to depreciate
its currency because the one thing that central banks are good at is currency
depreciation, but in this case the upward pressure under the Yen as a result
of natural market forces is huge. Not only do the Yen bulls have the fundamentally
weak Dollar in their favour, there is a significant probability that the
Japanese stock market made a long-term bottom earlier this year. As such,
the Yen is likely to benefit from capital repatriation as well as new foreign
investment over the coming months.
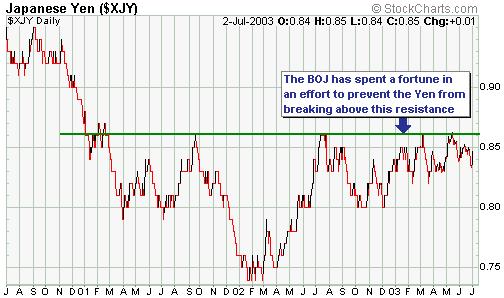
We expect the Yen to overcome the BOJ
intervention and break above the 86-87 level before the end of this year.
A reasonable upside target for the Yen over the next 12 months is 100 Yen
to the Dollar (about 15% above the current level).
Gold and Gold Stocks
From the latest Weekly Update: "Over
the past few weeks we've mentioned the $340-$345 range as a likely short-term
downside objective for August gold futures. Gold traded down to this level
last Thursday, so there is a reasonable chance that a short-term low is
in place. Lower levels are, however, probably going to be reached before
the next major advance gets underway. As previously advised, two consecutive
daily closes in the gold price above its 18-day moving average will warn
us that the short-term trend has turned higher."
The rebound in the gold price over
the past few days confirms that a short-term low was, indeed, put in place
last Thursday. As the below chart shows, gold has now traded back up to
resistance defined by the 18-day moving average, the 50-day moving average
and the short-term channel, so the short-term upside potential from here
is minimal IF we were correct when we stated that lower levels would be
reached before the next major advance gets underway.
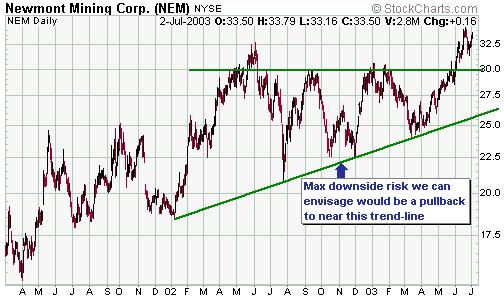
Regardless of what happens in the short-term,
the upside breakout in the NEM stock price in early June (see chart below)
supports our view that gold and gold stocks are headed much higher before
the end of this year. We expect NEM to trade up to $50 within the next
12 months, although we are not interested in buying the stock because the
type of financial market environment in which NEM would gain 50% from its
current level would result in most of our junior gold stocks experiencing
much greater percentage gains. If gold and gold stocks pullback over the
next few months then NEM could drop all the way back to around $26-$27
without doing significant damage to the technical picture, although it
is more likely that support at around $30 will contain any pullbacks.
Looking for investment-grade buying
opportunities amongst the juniors
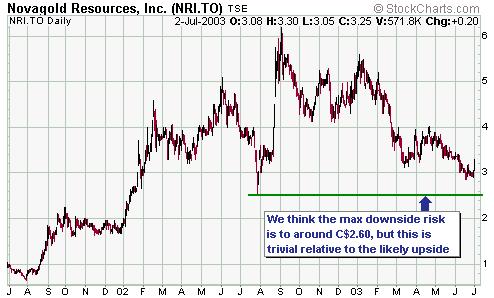
In last week's Interim Update we included
a valuation comparison of junior gold stocks and mentioned that NovaGold
Resources (TSX: NRI) was the one stock covered in our comparison table
that currently wasn't in the TSI Stocks List and that we would add to the
List if we weren't already overloaded with gold stocks. Overloaded or not,
having done some more research on NRI we are going to add the stock to
the List now. The below review of NRI explains why.
First, some introductory information.
Historically, markets have valued exploration/development
stage companies based on the stage of advancement of their projects to
production and/or the likelihood of a takeover prior to production. For
North American based companies the average adjusted market cap (market
cap plus debt minus cash) per ounce of the total MI&I (measured, indicated
and inferred) resource for a producing company is a little more than $100/oz.
At the Feasibility stage it is typically $30-50/oz, at the Pre-Feasibility
stage it is around $20 per ounce, and at the resource definition stage
post discovery it is typically $5-10 per resource oz. These values appear
to reflect the market discount that the project will make it to production,
that is, Feasibility-stage ounces attract a 50% discount to a production
valuation, Pre-Feasibility ounces a 50% discount to the Feasibility level,
etc. Takeovers such as Francisco Gold by Glamis have tended to be somewhere
between Feasibility and production valuation levels on a per resource ounce
basis.
Using this approach a systematic progression
is seen in increased value as a project goes from initial discovery and
resource definition to eventual production or takeover. In fact, based
on this approach there is potentially as much increase in value from the
resource definition to production stage as there is in the initial discovery
phase but with a much higher likelihood for success and therefore lower
risk since a gold deposit has already been found. Depending on how many
shares a company will need to issue to progress their project from stage
to stage this could represent as much as a doubling in share price at each
development milestone.
With the above in mind, let's now take
a look at NovaGold.
Below is a chart that shows the estimated
stock price of NRI at various stages of development assuming a) a gold
price of $325, and b) that NRI will need to issue an additional 10M shares
to fund its portion of the Donlin creek construction costs. The black vertical
line indicates the current amount of NRI's total gold resource (assuming
NRI ends up owning 30% of the Donlin Creek project), so the point on the
left-hand scale corresponding to the intersection of the black vertical
line with one of the coloured lines shows what the NRI stock price will
potentially be at a particular stage of development.
The current development schedule for
the Donlin Creek Joint Venture is to complete the Pre-Feasibility Study
in Q4 2003. Therefore, the above chart suggests that a reasonable value
for NRI at the end of this year would be US$5/share (C$6.60/share) assuming
the current schedule is achieved and a gold price of $325/ounce. In other
words, there appears to be substantial upside potential in NRI over the
next 6 months even if the gold price does not rise. Another way
to look at the situation is that there is a substantial margin of safety
built into NRI's current stock price.
The Feasibility definition drilling
is scheduled to be completed during 2004 with the Feasibility Study anticipated
to be complete in late 2004. Final permitting and design work would be
targeted to begin in early 2005 with a construction decision no later than
2007 (most likely in 2006) for Placer Dome to earn its additional 40% in
the project. Due to the size of the mine, construction will likely take
12 or more months with first gold production coming in 2007 or 2008. Total
gold production is currently anticipated to be 1.0 to 1.2 million ounces
per year with NovaGold's share of production anticipated at 300,000 to
400,000 ounces per year.
Note that under the joint venture agreement
between Placer Dome and NovaGold, Placer will finance the project from
now until the point where a construction decision is made. In fact, NRI's
involvement in Donlin over the next 2-3 years should be minimal, enabling
the company to focus on its other projects.
Speaking of other projects, prior to
Donlin Creek coming on stream NovaGold will be advancing its two wholly
owned projects in Nome, Alaska to production decisions. At the Rock Creek
Project the 1.1 million ounce deposit is anticipated to produce 100,000
ounces per year from an open-pit operation. An independent Scoping Study
is expected by mid-summer 2003 with on-going feasibility drilling through
the fall. A revised resource estimate is expected after final assays are
complete late in 2003. The Feasibility Study is anticipated to be complete
by mid-2004 with a production decision shortly thereafter. Permitting would
likely take 12 months or less, so construction could then begin in mid-2005
with the first gold production in late 2005.
Concurrently, NRI is reviewing restarting
gold production on its Nome Gold Project. The deposit hosts 2.3 million
ounces of gold that is anticipated to begin production at 50,000 ounces
per year with by-product sand-and-gravel production. The project would
be very scalable with increased production easily added. An independent
engineering evaluation is currently underway with results anticipated to
be ready by fall 2003. With positive initial results Feasibility engineering
work could be completed in early 2004. A Production decision, final permitting
and construction could then be possible by late 2004 or early 2005.
NovaGold is also working with TNR Gold
on the 1 million ounce Shotgun project south of Donlin Creek to expand
the current resource and target the potential for a multi-million ounce
Donlin Creek type system.
A lot of junior gold companies have
great potential, particularly given the very bullish outlook for the gold
price, but they are too risky to be considered 'investment grade' (an investment
grade opportunity is one where the upside potential is good and
where the downside risk is sufficiently low that making a sizeable commitment
is feasible). Companies that have yet to establish a proven resource base
are especially risky. Such companies sometimes provide their owners with
spectacular profits, but the risk of failure is so high that they are only
ever suitable for small speculations. Near its current price NRI, in our
view, represents an investment-grade opportunity.
Update
on Stock Selections
 The
Feasibility Study(FS) for Desert Sun's Jacobina gold project in Brazil
is due to be complete by mid August. If the current FS confirms the resources
and reserves that were previously established for this project then Desert
Sun (TSXV: DSM) is dramatically under-valued at its current stock price.
For example, using the US$30/ounce figure mentioned in the NRI discussion
above for Feasibility-stage resource ounces, the 3M ounces at Jacobina
would be worth around US$90M (C$120M) assuming a successful outcome for
the FS. DSM's fully-diluted share count is 36M, so this suggests a potential
stock price of C$3.30 following completion of the FS. There is more risk
associated with Brazil than North America, but a stock price in excess
of C$2.00 certainly seems reasonable for DSM over the next several months
assuming no increase in the gold price. The
Feasibility Study(FS) for Desert Sun's Jacobina gold project in Brazil
is due to be complete by mid August. If the current FS confirms the resources
and reserves that were previously established for this project then Desert
Sun (TSXV: DSM) is dramatically under-valued at its current stock price.
For example, using the US$30/ounce figure mentioned in the NRI discussion
above for Feasibility-stage resource ounces, the 3M ounces at Jacobina
would be worth around US$90M (C$120M) assuming a successful outcome for
the FS. DSM's fully-diluted share count is 36M, so this suggests a potential
stock price of C$3.30 following completion of the FS. There is more risk
associated with Brazil than North America, but a stock price in excess
of C$2.00 certainly seems reasonable for DSM over the next several months
assuming no increase in the gold price.
One
of the most under-valued gold stocks at the present time is Northgate Exploration
(TSX: NGX). In fact, the market appears to be assigning almost no value
to NGX's 6.6M ounce Kemess North resource (Kemess North is currently in
the pre-feasibility stage). We have no idea what the NGX stock price is
going to do in the short-term, but expect NGX to be one of the best-performing
mid-tier gold producers over the next 12 months.
NovaGold
Resources (TSX: NRI) will be added to the Stocks List using yesterday's
closing price of C$3.25 for record purposes.
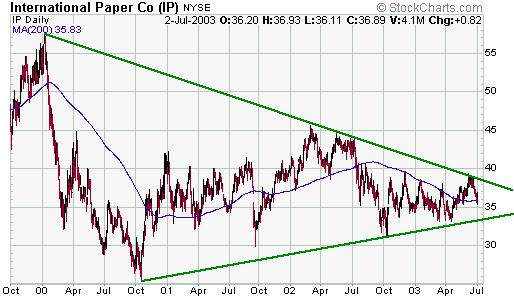
In
May we said we would add International Paper (NYSE: IP) to the Stocks List
if it traded down to around $34 (a level that roughly corresponds to the
uptrend-line shown on the below chart). IP is a company that stands to
benefit from the on-going inflation and US$ weakness, so a long position
in this stock is consistent with our overall thesis. IP hasn't yet pulled
back to its ideal 'buy level', but we are going to add it to the List now
because the risk/reward looks attractive. We'll place an initial sell stop
at $30.90 (just below the October-2002 low).
Not
all the stocks in the TSI Stocks List are a 'buy' at any given time. However,
if a stock is in the List then it was considered to be a 'buy' when it
was added and is certainly still considered to be a 'hold' (note that when
we say hold we really do mean hold, unlike in 'Wall St speak' where a hold
recommendation means 'get out now because the stock price is about to plummet').
What we have been doing over the past
few months, and will continue to do, is point out when one of our favourite
stocks has dropped to a level where we think new buying is appropriate.
For example, over the past 3 months we've mentioned DSM on 2 or 3 occasions
when its price dropped to support in the C$0.80-0.85 range, WTC when it
was trading in the C$2.70-3.00 range, the Wheaton River warrants on at
least 3 occasions when they were trading in the C$0.50-0.57 range, GPXM
at US$0.23 and then at 0.28, AQI initially at C$0.26 and then in the 0.30-0.40
range, CBD below C$2.50, and NRI at C$2.95 last week. In general, our goal
is to buy stocks in a bull market (in this case gold stocks) after they
pullback to near important support and to avoid chasing stocks after they've
broken out to the upside.
As an aside, at the current time it
is dangerous to trade the junior gold stocks with the aim of sidestepping
the normal pullbacks in the market because the upside risks are so much
greater than the downside risks. For example, all of the stocks in the
TSI List are either fairly valued or under-valued assuming a gold price
of $325, so there is no speculative excess built into their prices. As
such, although we think the odds favour a pullback into August anyone who
sells these stocks with the aim of buying back at a lower price over the
next few months is taking what we think is an unnecessary risk.
If
your equity-market portfolio has been constructed roughly in line with
what has been suggested at TSI, then you would:
a) Be long the Japanese stock market
via an index fund such as EWJ
b) Be long a couple of commodity-oriented
stocks
c) Have a large long position in the
gold sector with particular emphasis on the junior gold stocks (you would
own at least 7 junior gold stocks)
d) Be out of the stock market apart
from the specific areas mentioned above
e) If you happen to be an experienced
options trader, have a small bearish position on the US stock market via
some put options
Chart Sources
Charts appearing in today's commentary
are courtesy of:
http://stockcharts.com/index.html
http://www.futuresource.com/

|
