![]()
![]()
![]()
![]()
- Interim Update 2nd September 2020
Copyright
Reminder
The commentaries that appear at TSI
may not be distributed, in full or in part, without our written permission.
In particular, please note that the posting of extracts from TSI commentaries
at other web sites or providing links to TSI commentaries at other web
sites (for example, at discussion boards) without our written permission
is prohibited.
We reserve the right to immediately
terminate the subscription of any TSI subscriber who distributes the TSI
commentaries without our written permission.
The August-2020 Monthly
Closing Prices
Today we will review monthly
charts for gold, the HUI, the S&P500 Index (SPX), the Dollar Index and the
Australian dollar, starting with gold.
In last month's review of
monthly closing prices, we wrote:
"...the US$ gold price ended
the month of July-2020 above its 2011 high. This means that there is
nothing but blue sky above the current price, but it doesn't ensure that
the market will continue along its recent upward path. A downward
correction in the gold price should accompany the next meaningful upward
correction in the Dollar Index, which looks set to get underway soon."
A meaningful upward correction in the Dollar Index (DX) didn't get
underway in August, but a downward correction in the gold price may have
commenced early in the month following a spike up to around US$2100.
The following monthly chart shows that during August the US$ gold
price traded well above and well below its July-2020 close before ending
the month with a small net loss. This sort of price action after a strong
rally can mark a top. As discussed in recent TSI commentaries, a
multi-month top would be confirmed by a weekly close below US$1920.
As mentioned in previous discussions of monthly prices, critical
monthly-closing support for gold's intermediate-term upward trend is
defined by the 8-month MA (the black line on the following chart). That
is, a monthly close below the 8-month MA would indicate that a top that
holds for more than a few months is in place. This MA continues to rise
and should be near $1800 a month from now.
Ideally (from a
long-term bull's perspective) there will be a test of or an intra-month
spike below the 8-month MA, but not a monthly close below the 8-month MA,
at some point over the next two months as part of a 'corrective' process.
The next monthly chart shows that the HUI's performance during August
was similar to gold's, except that the HUI ended the month with a small
net gain. The implication is the same, in that the upward spike in
early-August potentially marked a multi-month top.
A correction
within the next two months could take the HUI down to the mid-200s and
could even test the 21-month MA (the blue line on the following chart),
but despite this short-term risk the intermediate-term risk/reward remains
very bullish.
The US stock market's post-crash rebound continued in August and the
SPX just achieved a monthly close above its February-2020 high. This means
that for the SPX the Q1-2020 crash was an intermediate-term bull-market
correction rather than the first leg of a bear market. However, broader
indices that are not dominated by a handful of mega-cap tech stocks are
well below their all-time highs, so the overall market's long-term trend
is not clear.
The summary of our 1-2 year outlook included in each
of our past two discussions of monthly closing prices still applies. Here
it is again: We think that the March-2020 low will NOT be tested over the
remainder of this year or the first half of next year, but that it will be
tested in parallel with another recession during 2022.
By early-June we were confident that the US$ had made a long-term top,
but it wasn't until 31st July that almost all remaining doubt was removed
via a monthly close by the Dollar Index (DX) below its March-2020 low.
It is highly probable that the DX is about 5 months into a 1-2 year
downward trend, but there will, of course, be significant rebounds on the
way to much lower levels. It looks like such a rebound is about to begin.
The coming DX rebound could be strong, but assuming it's a
countertrend move it shouldn't achieve a monthly close above the 20-month
MA (the blue line on the following chart).
The Australian dollar (A$) has managed five big consecutive up-months
since bottoming in March-2020. Over the past 15 years, the only other time
it has done anything like this was in the early part of the 2.5-year
cyclical bull market of 2009-2011. Therefore, it's fair to say that the
price action remains consistent with our view that the A$ commenced a
cyclical bull market in March-2020.
From here on, significant
corrections in the A$ probably will be limited by the 20-month MA (the
blue line on the following chart). It's likely that the A$ will experience
such a correction in parallel with the next meaningful stock market
decline.
By the way, our outlook for the Canadian dollar (C$) is
similar to our outlook for the A$, although we expect the C$ to
underperform the A$ over the coming two years. The main reason is that the
C$ tends to be weak relative to the A$ during multi-year periods when the
Dollar Index is weak. This is probably because of the closeness of the
Canada and US economies.
The shortest US
recession ever, update
Three months ago we wrote that
the National Bureau of Economic Research (NBER), the official arbiter of
US recessions, could determine that the 2020 recession was over by July,
making it the shortest US recession ever. We also wrote that there was so
much 'rot' in the economic foundations that the US economy would recover
only 80%-90% of what it lost during the first half of this year before
turning back down. Two months ago we wrote that the spectacular rise in
the ISM New Orders Index (NOI) suggested that the recession actually ended
in June, a view that was reiterated a month ago.
The latest NOI was
published on Monday of this week and there is now almost no doubt that the
recession ended in June. As shown below, the NOI continued its rapid rise
in August and has reached its third highest level of the past 20 years.
The rise in the NOI to its third highest level in 20 years doesn't
imply that the US economy is now very strong. It indicates that a
substantial majority of the purchasing managers who are surveyed by the
ISM are seeing improvement in order flow. This means that it indicates
widespread improvement from a very low level as opposed to widespread
strength. That being said, the lead-lag relationship between the ISM NOI
and Industrial Production (IP) suggests that a strong recovery in IP will
be underway by the first quarter of next year.
The continuing surge
in the ISM NOI is bullish for industrial commodities and bearish for gold
and T-Bonds. This is consistent with our view that the industrial metals
will outperform gold over the coming 6-12 months, or, to put it more
accurately, that the industrial metals will continue to outperform gold
for another 6-12 months (gold peaked relative to the Industrial Metals
Index (GYX) in April). However, beyond the next 12 months we are more
bullish on gold, because the problems caused by this year's efforts to
prop-up the economy and asset prices should ensure that the US economy
slumps back into official recession territory during 2022.
The Stock Market
Current Market Situation
The "implied" volatility measured by the VIX, that is, the volatility
implied by options prices, has risen over the past several days.
However, rarely has actual price volatility been lower. As illustrated
below, the Russell2000 ETF (IWM) has worked its way upward at a slow pace
along its 20-day MA over the past 8 trading days and has spent the past 18
trading days within a 3% range.
There are no signs of trouble except for the market's bad breadth, but
the bad breadth is potentially important. We are referring to the fact
that the bulk of the recent upside in the highest-profile stock indices is
due to strength in a small number of mega-cap stocks.
The breadth
issue is evidenced by the following comparison between the SPX and the
NYSE Advance-Decline Line (ADL). Specifically, by the fact that the SPX
has moved well into new-high territory over the past two weeks while the
ADL has remained well below its early-August high.
The bearish
divergence between the SPX and the ADL could be eliminated over the weeks
ahead via a broadening-out of the rally, which probably would be of
greatest benefit to commodity-related equities. However, it also could be
eliminated by a sizable correction in the SPX. Our 'core' exposure
positions us for the former possibility and we have used options to hedge
against the latter possibility.
The short-term risk is substantial and increases with every new high
in the senior stock indices, but there is no reason that the relentless
rise can't continue for a few more weeks.
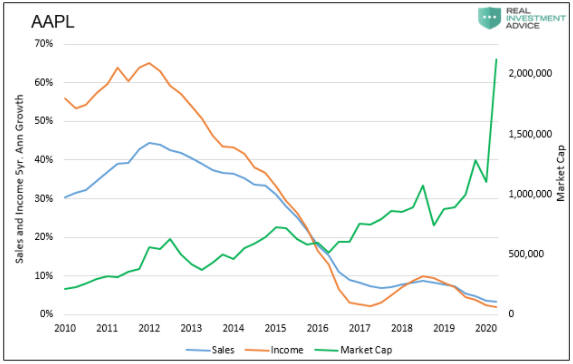
Apple Mania
The following chart from the article posted
HERE does an excellent job of illustrating the absurdity of Apple's
stock-price performance over the past several months. The chart shows that
Apple's sales and income have barely grown at all over the past 5 years
while the company's market capitalisation has exploded.
Gold and the Dollar
Gold and Silver
In the latest Weekly Update, we wrote:
"We continue to
think that a multi-month top for the US$ gold price was set in
early-August, but a weekly close below US$1920 is required to confirm this
view. Also, even if a multi-month top is in place, as part of a topping
process there could be a rise to the mid-US$2000s within the coming
fortnight. This would be signalled by a daily close above the 20-day MA."
The short-term chart pattern didn't change over the first three days
of this week. The gold price spiked up to $2000 on Tuesday but didn't
manage to close above its 20-day MA. On Wednesday the price fell by almost
2% but held above support at $1920.
So, it still looks like a
multi-month top was set in early-August and there is still a chance,
albeit a diminishing one, of a rise to the mid-US$2000s within the coming
1-2 weeks as part of a topping process.
At this stage we think that
October is the most likely time for a short-term price low and the
resumption of the longer-term upward trend.
Regarding silver, here's what we wrote in the latest Weekly Update:
"A daily close by silver below its 20-day MA would be a
preliminary signal that the next meaningful decline has begun, while a
daily close below short-term lateral support at US$26.00 would be a more
conclusive signal.
Once the start of a decline is signalled as
outlined above, the 200-day MA will become a reasonable target for a
correction low. This MA should be at or above US$19.00 during October,
which is the most likely month for a correction low."
Despite
a 4.4% decline in Wednesday 2nd September, the US$ silver price held above
its 20-day MA on a daily closing basis (by the slimmest of margins).
Therefore, nothing has changed.
If a) you have substantial exposure to gold and silver bullion and/or
the associated mining stocks and b) you are experienced with options
trading, then you could hedge your exposure via GLD and/or SLV and/or GDX
put options expiring in October or later. FYI, we have been accumulating
SLV $23 put options and GLD $170 put options expiring on 16th October
2020.
Gold Stocks
Since the end of last
week there has been a net change of only 2 points in the HUI and there
have been no big price swings, so the situation is unchanged. It's still
the case that the most likely direction of a sustained breakout from the
trading range of the past month is down, as this would be consistent with
the August-September cycle and the strong potential for a US$ rebound.
However, it's also still the case that a short-term inflationary blow-off
cannot be ruled out.
The Currency Market
We sent an email to
subscribers after the close of US trading on Monday 31st August. The main
purpose of the email was to confirm that, for TSI record purposes, profits
were being taken on the Taseko Mines (TGB) position, but we also wrote:
"This is a critical short-term juncture in the financial world
because we are about to get either a downside breakout or an upward
reversal in the Dollar Index (DX). It's a good bet that the former would
lead to upward acceleration in the prices that have been trending higher
over the past few months, while the latter would usher-in significant
corrections in the markets that have rallied over the past few months. We
think it's important to be hedged against the latter possibility while
maintaining core exposure in line with the US dollar's cyclical bearish
trend."
On Monday the DX closed exactly at its mid-August low
of 92.1, which also was its low for the year. On Tuesday the DX traded at
a new low for the year and then reversed course to end the day with a
small gain. It gained additional ground on Wednesday.
The price
action of the past two days is very preliminary evidence of a reversal in
the DX's short-term trend from down to up. A daily close above 93.5 would
generate more conclusive evidence and a daily close above 94 would leave
little room for doubt that a short-term bottom (a bottom that holds for
1-3 months) is in place.
If the DX's short-term trend has reversed,
then within the next three months it should trade at least as high as
95.5-96.0 and could rise as far as resistance at 97.5-98.0.
Updates on Stock Selections
Notes: 1) To review the complete list of current TSI stock selections, logon at
http://www.speculative-investor.com/new/market_logon.asp
and then click on "Stock Selections" in the menu. When at the Stock
Selections page, click on a stock's symbol to bring-up an archive of
our comments on the stock in question. 2) The Small Stock Watch List is
located at http://www.speculative-investor.com/new/smallstockwatch.html
Chart Sources
Charts appearing in today's commentary
are courtesy of:
https://stockcharts.com/
![]()