|
- 02 October, 2002
The US
Stock Market
The European Markets
We are very comfortable being bearish
on the US stock market because technical, sentiment and fundamental indicators
are all saying the same thing, that is, they are all saying that the market
is headed much lower. The US market is clearly in the midst of a primary
downtrend, sentiment is still way too bullish, and, based on reliable long-term
measures of valuation such as dividend yields and price/sales ratios, the
overall market has a long way to fall before it reaches fair value.
We are not, however, comfortable being
bearish on the major European markets at this time. Firstly, we don't have
a feel for current valuation levels in Europe nor have we done any research
on what the valuation levels of the European markets have been in the past
near the bottoms of major bear markets. However, our understanding is that
European stocks were, on average, not as over-priced as US stocks at the
beginning of the bear market. Therefore, given the fact that the European
markets have fallen much further than the US market it is possible that
the European markets are already fairly valued, or perhaps even under-valued.
If any of our European readers have valuation data on the German and French
markets (e.g., average dividend yields, price-to-earnings ratios and price-to-sales
ratios) we'd certainly be interested in seeing it and would share the information
with all our readers.
Secondly, although the European markets
have not yet shown any signs of strength, the waterfall declines experienced
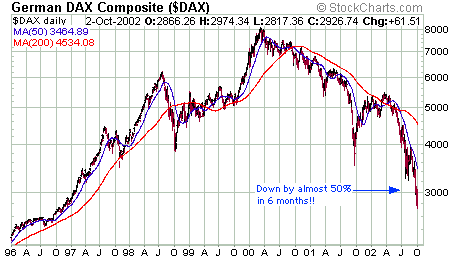
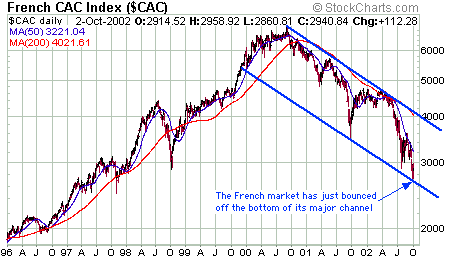
by these markets over the past 6 months (see charts below of the German
and French markets) have the appearance of capitulation on a grand scale.
The German market, for example, fell by almost 50% from its March-2002
high to its recent low. There is no evidence that Germany's DAX Index has
already bottomed, but even if a long-term bottom is not being put in place
this is the type of decline that is likely to be followed by a cyclical
(1-2 year) bull market. If the US market had fallen this far then the Dow
would now be around 5,300 and we would almost certainly be positioning
ourselves for a cyclical bull market. The French market hasn't fallen as
far as the German market in percentage terms, but it has just bounced off
the bottom of its primary downward-sloping channel. This means the market
is positioned for at least a sizeable counter-trend rally. If the US market
was in a similar position, from a technical perspective, then the S&P500
would be around 720.
Because we haven't yet done a valuation
analysis of the European markets we can't recommend buying into these markets
at current levels, but do suggest that investors who are interested do
their own due diligence on these markets. The returns over the next 12
months will potentially be high, particularly in US$ terms (we expect the
euro to move much higher against the US$ over the next 12 months).
Looking for similarities in all
the wrong places
When the Dow Industrials Index tested
its July low last week we noticed that comparisons with 1974 started popping
up all over the place. In 1974 the Dow bottomed in October and re-visited
that bottom 2 months later in December before embarking on a huge rally.
This year, the Dow bottomed in July and tested that bottom 2 months later.
There are numerous reasons why it makes
no sense to compare today's market with the 1974 market, including the
fact that when the market was bottoming in 1974 the Dow's dividend yield
was 6.5% versus today's 2.4%. What we found interesting, though, is the
on-going eagerness of people to grab hold of anything that has bullish
connotations. It didn't matter that there were no other similarities between
the current situation and the situation in 1974, as soon as the current
Dow began to exhibit a similar pattern to the bottoming phase of October-December
1974 this particular similarity was seized upon as being evidence that
a long-term bottom had been reached.
The bulls will no doubt argue that
today's low interest rates mean that the Dow's dividend yield should be
a lot lower now than it was at the 1974 bottom, but the low interest rates
are, themselves, a sign that the stock market is not close to a major bottom.
Major bottoms in the stock market occur when long-term interest rates are
near a peak, not when they are at multi-decade lows. Also, the low interest
rates are the result of economic/financial problems throughout the world,
flight to safety buying, leveraged speculation in the bond market, derivative
bets gone wrong, and forced buying on the part of Government Sponsored
Enterprises. They are not a consequence of something positive such as high
productivity or low inflation.
Current Market Situation
In the e-mail alert sent to subscribers
prior to the start of trading on Wednesday we said: "At best, the market
might move higher by as much as 15% over the coming 2-4 weeks before resuming
its decline (when we talk about "the market" we mean the S&P500 Index).
At worst, the market could fall by 15% over the next few weeks (a 15% decline
over the next 4 weeks would take the S&P500 to the bottom of its major
downward-sloping channel). In our view, the odds favour the latter (another
plunge), but not by a big enough margin to warrant initiating any bearish
positions at this time."
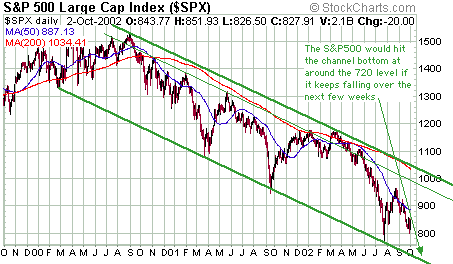
The following chart shows how we came
up with the plus/minus 15% figure mentioned above. In our view the short-term
downside risk is limited by the bottom of the primary channel, which would
be hit if the S&P500 Index fell to around 720 (15% below Tuesday's
closing level). The short-term upside risk is, we think, limited by the
thin green trend-line shown on the chart. This trend-line would be hit
on a quick move to around 980 (15% above Tuesday's closing level).
As noted in the e-mail we think the
odds favour a drop to the channel bottom over the next few weeks, but not
by enough to warrant buying more put options at this time. If we do get
a drop to the channel bottom along with a sharp spike in fear over the
coming weeks then we would become enthusiastic buyers of the market in
anticipation of a rebound to the top of the major channel. A move from
the bottom of the channel to the top of the channel would result in a gain
of at least 30% in the S&P500 Index and probably much greater percentage
gains in the NASDAQ indices and many tech stocks.
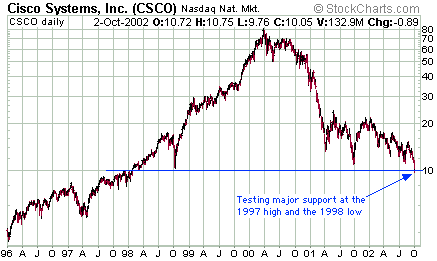
Below is a chart showing the Cisco
stock price since the beginning of 1996. We have never traded CSCO (a situation
that might change over the next few weeks), but watch it closely because
it is often a good leading indicator of the overall market. On Wednesday
CSCO briefly traded in single digits before recovering slightly to close
at $10.05. It is now poised at support defined by its 1998 low and its
1997 high.
There is little chance that CSCO has
reached a major bottom since it is still selling at 4-times sales (at least
double what it should be selling at). However, sentiment towards what was
once the most loved stock in the world is now turning bearish enough that
an additional 10%-20% decline in the short-term would probably set the
stage for a substantial counter-trend rally.
Commodities
We have been long-term bullish on commodities
for the past few years and short-term bullish since the first quarter of
this year. This bullish view often prompts the following question from
readers: "If economic growth is going to remain weak over the foreseeable
future, how can commodity prices possibly rise?"
The answer to the above question is
encompassed in the fact that the US$ price of a commodity is determined
by the supply/demand situation for that commodity and the supply/demand
situation for the US$. For example, if the supply of and the demand for
a commodity remain the same while a) the supply of US Dollars is increasing
and/or b) the demand for US Dollars is falling, then there is a good chance
that the price of the commodity will rise. This assumes that a reduction
in the purchasing power of the US$ will benefit commodity prices rather
than, for instance, financial asset prices. However, given that stock prices
are still in the early stages of a secular bear market and commodity prices
(as represented by the CRB Index) are near 4-year highs, this seems like
a reasonable assumption.
Gold and
the Dollar
Understanding the Commitments of
Traders (COT) Data
The COT Report shows the total number
of outstanding futures contracts in a particular commodity and how those
contracts are split between "reportable positions" (large traders) and
"non-reportable positions" (small traders). The large traders are considered
to be the 'smart money' because, as a group, they have greater financial
strength and are better informed than the small traders (known as the 'dumb
money'). The large traders are, themselves, split into two groups - commercial
traders (large traders that also deal in the cash market for the commodity)
and speculators (large traders that have no dealings in the cash market).
The traders' commitments data behave
differently depending on the commodity. So, for the purpose of this discussion
we'll use the example of gold futures since this is one commodity we follow
closely and one for which the COT Report can be a useful indicator.
The 'commercials' are often considered
to be the 'smartest money' because they are supposedly the best informed
group with respect to the supply/demand fundamentals in the market. As
such, it is often said that the traders' commitments for gold are bearish
when the commercials are net-short and bullish when the commercials are
net-long. However, we don't look at the COT Report in that way.
What we've observed over the years
is that the commercials in the gold market are almost always wrong.
When the gold price is in a strong up-trend they tend to be net-short and
when the gold price is in a strong downtrend they tend to be net-long.
The one time they are invariably right, however, is at price extremes.
When the gold price reaches a major high the commercials always have a
large net-short position and when the gold price reaches a major low the
commercials always have a large net-long position. They are, therefore,
always on the right side of the market at major turning points. The problem
is, there are no absolute levels for the sizes of commercial net-positions
that correspond with major peaks and troughs. All we can say is that when
the commercial net-short position or net-long position approaches a level
that was previously seen at an important peak or trough, the risk of a
turn is high. In such a case we should look to other indicators for signs
that an important peak or an important trough is close at hand.
In addition to looking at what the
commercials are doing, it is important to also look at what the small traders
are doing. For example, assume the gold price is trending higher and the
commercials are heavily net-short. If this net-short position was mostly
offset by the net-long position of large speculators, while the small traders
were essentially 'flat' (neither short nor long), we wouldn't consider
the COT data to be signaling an impending peak. This is because the commercials
and the large speculators are both 'smart money'. In this case the COT
data would be inconclusive. However, if the large net-short position of
the commercials was mostly offset by the net-long position of small traders
(the 'dumb money'), we would consider the COT data to be very bearish.
This is, by the way, the current situation in the gold market.
We are not aware of such a situation
occurring in the gold market, but in other markets there have been occasions
when both the large speculators and the commercials have been lined up
on one side of the market while the small traders were betting heavily
in the opposite direction. This actually occurred earlier this year in
the S&P500 futures market when both the large specs and the commercials
were heavily net-short while the small traders had a massive offsetting
net-long position. When the smart money is unanimous in its opinion and
the dumb money is heavily committed to the opposite viewpoint, the probability
of the dumb money being right is extremely small.
Targets
1. The US Dollar
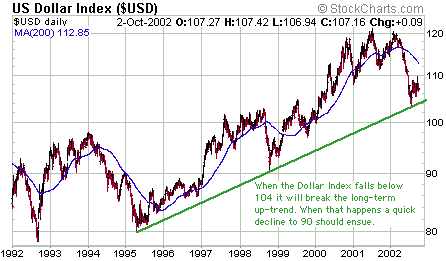
Below is a long-term chart of the Dollar
Index. This year's decline in the Dollar Index bottomed right at the long-term
up-trend, thus keeping alive the hope that the Dollar has completed a sharp
correction within an on-going bull market rather than entered a major bear
market. It is only a matter of time (a few months at most) until the long-term
up-trend is broken. When this happens it will be a 'point of recognition'
(a point where the trend change suddenly becomes widely recognised) and
is likely to set in motion a flurry of selling - speculative selling of
dollars in the futures markets and the dumping of US$-denominated assets
by foreign investors.
The major US stock indices and many
of the highest-profile individual stocks are either at, or below, their
October-1998 lows. Since the Dollar has been supported at elevated levels
over the past several years by capital in-flows and since these capital
in-flows were related, in part, to the performance of the US stock market,
we don't think it is unreasonable to expect the dollar's decline to be
of similar magnitude to the US stock market's decline. As such, we expect
the Dollar Index to fall to 90 (the 1998 low) within the next 6 months.
However, the bulk of this anticipated decline to 90 probably won't occur
until the first few months of next year because:
a) Sentiment and technical indicators
show that the Dollar Index is likely to trade up to 111-112 before the
next major decline gets underway
b) The downside risk in the US stock
market is, in our opinion, limited to about 15% in the short-term
c) The US$ rarely falls during the
final quarter of the year. In fact, the US$ has fallen during the final
quarter in only one of the past 10 years.
2. Gold and Gold Stocks
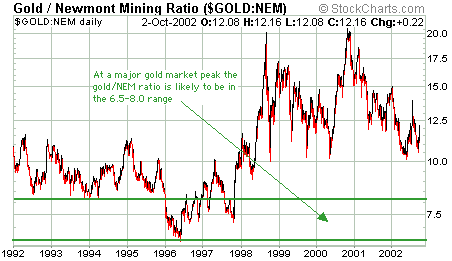
Below is a chart showing the ratio
of the gold price and the NEM stock price since the beginning of 1992.
We are using NEM here as a proxy for the large, unhedged gold stocks of
the world. The chart suggests that a major peak in the gold market will
correspond to a gold/NEM ratio in the 6.5-8.0 range (at the 1993/1994 peak
the ratio was 8.0 whereas at the 1996 peak it was 6.5). If the gold price
peaks at around $400 during the coming 12 months then, based on this chart,
the NEM stock price will peak somewhere in the $50-$61 range (90%-130%
higher than yesterday's closing price).
If the current gold stock rally ends
up achieving the same percentage gain as the 1972-1974 rally, then the
HUI will peak at around 210 (75% above yesterday's closing price). The
last time the HUI traded at 210 was during the second quarter of 1996.
The gold price, at that time, was $390. Therefore, a rally in the gold
price to around $400 should allow the current gold stock rally to roughly
achieve equivalence with the 72-74 rally.
Based on the current rate at which
the S&P500 Index is falling relative to the gold price, the lowest
value the S&P500/gold ratio could trade at by the end of next year
is 1. If this lowest value is achieved and our target of 400 for the S&P500
Index is also achieved, then the gold price will be $400 at the end of
next year. If, however, the S&P500 Index remains in a 750-850 range
over the coming 15 months then the current rate of decline in the S&P500/gold
ratio would allow for a gold price of $400 during the first quarter of
next year and $800 by the end of next year.
As is always the case the price of
gold and, hence, the prices of gold stocks, will mostly be determined by
what is happening in other markets, the most important of which is the
currency market. At some point during the next 6 months we expect the Dollar
Index to step off a cliff (as far as the dollar is concerned moving below
104 will be the equivalent of stepping off a cliff) and accelerate lower.
Prior to this happening we will certainly want to have a maximum long position
in gold stocks. However, at this stage it looks like a breakdown in the
dollar will not occur until early next year. As such, we are probably still
a few months away from the start of a major gold rally, a conclusion that
is consistent with gold's bearish COT data.
When the US$ Index does break below
104 we expect that the ensuing rapid decline down to near the 1998 low
will be sufficient to push the gold price to $400. Furthermore, the probability
of this happening will be increased if the S&P500 Index does not
collapse with the US$.
The above-mentioned rise in the gold
price would likely result in the major gold stocks trading 75%-130% above
current prices, depending on each company's leverage to the spot gold price.
The percentage gains in many of the junior stocks would, however, be MUCH
greater.
Current Market Situation
There are no changes to our short-term
market views as outlined in the latest Weekly Market Update.
Our plan, over the next 2 months, is
to average into a few of the junior gold and silver stocks during periods
of weakness. Buying the dips in a bull market (gold stocks are in a bull
market) is a low-risk activity because your timing does not have to be
exact. If you buy too early during a dip you will suffer a temporary draw-down
but will eventually show a good profit. Buying the dips in a bear market
is a much more treacherous activity because your timing must be very accurate
in order to avoid losses.
Chart Sources
Charts used in today's commentary were
taken from the following web sites:
http://stockcharts.com/index.html

|

