![]()
![]()
![]()
![]()
- Interim Update 2nd November 2016
Copyright
Reminder
The commentaries that appear at TSI
may not be distributed, in full or in part, without our written permission.
In particular, please note that the posting of extracts from TSI commentaries
at other web sites or providing links to TSI commentaries at other web
sites (for example, at discussion boards) without our written permission
is prohibited.
We reserve the right to immediately
terminate the subscription of any TSI subscriber who distributes the TSI
commentaries without our written permission.
US Recession Watch
The ISM New orders Index (NOI)
is the shortest-term leading indicator of US recession to which we pay
attention. It is not as reliable as Real Gross Private Domestic Investment
(RGPDI) and sometimes generates a false signal, but based on the
historical record it is far more likely to warn of a recession that
doesn't eventuate than to not warn of a recession that does eventuate. In
fact, over the past 50 years it only missed giving a timely warning of the
1973-1974 recession.
A recession warning is generated when the NOI
drops below 48 (the red line on the following chart). The NOI came close
to generating such a warning late last year and in August of this year,
but didn't do so.
The NOI for October was reported on Tuesday of
this week. At 52.1 it was down 3 points from September and indicates a
lacklustre economy, but it has not yet signaled the imminent start of a
recession.
The FOMC surprises no
one
With the Presidential election
less than a week away there was never a realistic possibility of the Fed
moving its interest-rate target at this week's FOMC meeting. However, the
Fed has implied that it expects to make its next rate hike in December and
the financial markets are also expecting a rate hike in December.
Whether the Fed actually does make its next rate hike in December will
largely depend on how the stock market performs in the meantime. There's a
high probability that the official interest-rate target will be hiked by
0.25% if the S&P500 Index (SPX) is above 2100 when the FOMC meets in
mid-December, but a rate hike will most likely not happen in December if
the SPX is below 2000.
The Stock Market
A new sentiment
indicator
The 10-day MA of the equity put/call ratio
reflects the sentiment of the general public (the proverbial dumb money).
For example, when 10-day MA of the equity put/call ratio is near the
bottom of its 2-year range it indicates that the 'dumb money' is
complacent. The 10-day MA of the OEX put/call ratio, on the other hand,
reflects the sentiment of professional hedgers (the smart money). For
example, when the 10-day MA of the OEX put/call ratio is near the top of
its 2-year range it indicates that the 'smart money' is more concerned
than usual about downside risk.
We therefore view the put/call
situation as being definitively bearish when the 10-day MA of the equity
put/call ratio is near the bottom of its 2-year range at the same time as
the 10-day MA of the OEX put/call ratio is near the top of its 2-year
range. The idea is that if the dumb money is fearless at the same time as
the smart money is fearful, the risk of short-term price weakness will be
relatively high.
In the past we've eyeballed separate charts of
the above-mentioned put/call moving averages to assess the put/call
situation. However, a simpler and more objective way of doing the
assessment is to divide the 10-day MA of the equity put/call ratio by the
10-day MA of the OEX put/call ratio. The result of this division indicates
the complacency/fear of the 'dumb money' relative to the 'smart money'.
The lower the number, the greater the short-term risk (since the 'dumb
money' has earned its reputation).
For lack of a better term and
because we haven't seen the it anywhere else, from now on we'll refer to
the 10-day MA of the equity put/call ratio divided by the 10-day MA of the
OEX put/call ratio as the TSI Put/Call Indicator (TPCI).
The
following chart shows the S&P100 Index (OEX) and the TPCI. On Tuesday of
this week the TPCI hit a 2-year low, implying relative fearlessness on the
part of the 'dumb money' and relatively-high short-term downside risk.
Current Market Situation
The SPX finally broke
below support at 2120 on Tuesday of this week. It then followed through to
the downside on Wednesday.
The "Brexit" sell-off low in the 1990s remains our 1-2 month target,
but due to the market now being short-term 'oversold' it is reasonable to
expect that a multi-day rebound or consolidation will soon begin.
We suspect that some sort of rebound will soon get underway, perhaps
following a test of the 200-day MA near 2080. But ideally (from our
bearish perspective), any rebound over the days ahead will not be strong
enough to enable the SPX to get back above 2120 on a daily closing basis.
It is worth pointing out that while the world's most important stock
index has broken out to the downside, some indices have not yet confirmed
the short-term bearish outlook. For one example, the Dow Transportation
Average (TRAN) has held up remarkably well over the past week. For another
example, while the Emerging Market Equity ETF (EEM) has been rolling over
to the downside, the following daily chart shows that it hasn't yet broken
below critical support at $36.00.
EEM has been given a helping hand
over the past several days by weakness in the US$ and will be acutely
vulnerable if/when the Dollar Index resumes its upward trend.
There is, of course, a short-term wildcard to contend with. We are
referring to the US Presidential election scheduled for next Tuesday. The
outcome of the election probably won't have much effect on what happens to
the stock market over the coming year, because both candidates have
promised to implement policies that will be economically disastrous.
Figuring out which would be better is like figuring out whether it would
be better to be killed by a crocodile or a shark. However, the election
could result in substantial volatility over the coming several days,
especially if it looks like Donald Trump's probability of victory is
rising or if Trump shocks the pollsters and actually wins. This is because
there is a lot more uncertainty associated with a Trump presidency than
with a Clinton presidency.
Gold and the Dollar
Gold
Our
thinking has been that the US$ gold price would rebound to resistance in
the low-$1300s, but not much further. As illustrated below, resistance in
the low-$1300s was tested on Wednesday 2nd November.
Our thinking is unchanged. There is clearly a chance that the
short-term rally will continue, but it's more likely that the gold price
is near the top of a range that will hold for at least a couple of months.
A pullback to near the rising 200-day MA (currently in the mid-$1270s)
would be perfectly normal.
The view that gold's initial rally from
its October low is complete or nearly so is supported by Wednesday's
downward reversals in the gold-mining indices and ETFs. We suspect that
the bearish implications of Wednesday's relative weakness in the
gold-mining sector will be short-lived, but the message is: the gold
market is likely to experience some consolidation over the next several
days.
Gold Stocks
The HUI has a confluence
of resistance at 220-225. First, there's lateral resistance at 220 defined
by short-term lows in late-August and mid-June. Second, there's lateral
resistance at 225 defined by numerous daily lows during September. Third,
there's the 50-day MA in the low-220s. And fourth, there's the channel top
near 220. It's not surprising, therefore, that the HUI is having trouble
closing above 220.
You don't need to know much to know that Wednesday's downward reversal
in the HUI was a bearish signal, especially given that it happened in
parallel with a gain in the gold price. However, it hasn't changed our
assessment of the near-term risk/reward. It implies that at least a few
days of consolidation are likely and keeps alive the possibility that a
test of the October low will happen before a more substantial rebound gets
underway, but the HUI still has short-term upside potential to around 250.
This is not a good time to be aggressive with regard to the buying of
gold stocks. It's a time to pick away at relatively high-quality and
under-valued gold-mining stocks during multi-day periods of weakness,
perhaps via the placement of under-the-market buy orders near support
levels that could be tested during pullbacks. It's also a time to be
quicker-than-usual to take profits on individual stocks that spike upward
in reaction to positive news.
Keep in mind that a) there is no
guarantee that the rally from the January-2016 bottom was the first
intermediate-term advance in a new bull market, and b) even if we are
dealing with a new bull market the next intermediate-term advance is
unlikely to start prior to the first quarter of 2017.
The
Currency Market
The Yuan Threat
Relative to the US$, over the past 2 years the Chinese Yuan has been
trending downward and has lost about 15% of its value. Refer to the
following chart of the Yuan/US$ exchange rate for details. According to
Donald Trump this is because China's government has been devaluing its
currency in an effort to obtain an unfair trade advantage, but we can be
sure that this isn't the case. We can be sure that the Yuan's 2-year slide
has not resulted from a deliberate effort to devalue because over this
period the Chinese have been relentless net-sellers of US$-denominated
reserves. This tells us that far from trying to reduce the Yuan's exchange
rate, the Chinese government has been making a concerted effort to prop it
up.
As we noted in earlier TSI commentaries, the Yuan has been
very over-valued relative to the US$ for at least a few years. About two
years ago it started to decline under the weight of this over-valuation
and would have declined at a faster pace if not for the interventions of
China's monetary authorities. In other words, China's government has been
attempting to manipulate the Yuan's relative value upward -- by selling US
dollars -- to counteract the market forces that have been pushing it
downward.
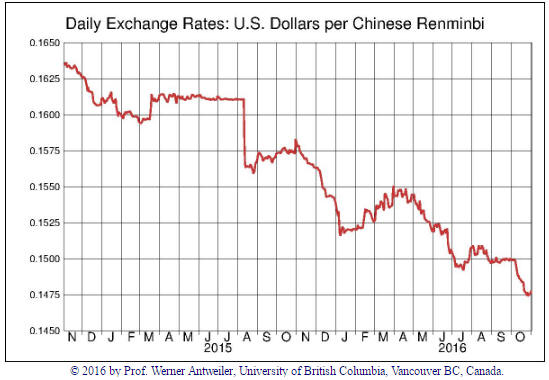
Chart source: Pacific Exchange
Rate Service
Interestingly, the financial world's perception of
the threat posed by a weakening Yuan has changed in a big way since the
middle of last year.
When China's government became overwhelmed by
market forces in August of last year and allowed the Yuan/US$ rate to
plunge to a level at which it could be at least temporarily supported,
there was widespread consternation. In fact, the Yuan's sudden downward
adjustment last August was one of the catalysts for that month's rapid
global decline in equity prices. Then, when the Yuan broke below its
August-2015 low in December-2015 it again caused widespread consternation
and again contributed to a rapid global decline in equity prices. However,
a series of new lows in the Yuan/US$ rate over the past four months has
been largely ignored by the global stock market.
Although it is
currently being ignored, the potential for significant additional weakness
in the Yuan poses a threat to equity prices and commodity prices.
The Dollar Index
The Dollar Index
has broken below support at 97.5. This suggests that the more important
support near 96.5 will be tested prior to a multi-week bottom, but the
performance of the US$ over the days ahead will be greatly influenced by
unpredictable shifts in expectations regarding the Presidential election
outcome and then the outcome itself.
It will make sense to simply
stay out of the way until after the election result is known.
Updates on Stock Selections
Notes: 1) To review the complete list of current TSI stock selections, logon at
http://www.speculative-investor.com/new/market_logon.asp
and then click on "Stock Selections" in the menu. When at the Stock
Selections page, click on a stock's symbol to bring-up an archive of
our comments on the stock in question. 2) The Small Stock Watch List is
located at http://www.speculative-investor.com/new/smallstockwatch.html
![]() Updates
to the
TSI
Small Stocks Watch List (SSWL)
Updates
to the
TSI
Small Stocks Watch List (SSWL)
The SSWL contains
stocks that are too small, too illiquid and/or too risky to be included in
the TSI Stocks List, but appear to have substantial upside potential. We
don't follow these stocks closely via the TSI commentaries, but they
warrant a mention because they could be of interest to risk-tolerant
speculators capable of doing their own company research. Today we are
making a brief comment on each member of the SSWL.
*A1
Consolidated Gold (AYC.AX) is a small-scale gold producer with a
high-grade gold project in Victoria, Australia. Financially, the company
is "sailing close to the wind". It doesn't have much money and its
operations were cash-flow negative last quarter, but there's a good chance
that it will become cash-flow positive this quarter.
The risk is
high, but the risk/reward is attractive near the current stock price of
A$0.028. At this stock price the market cap is A$19.7M.
*Cassini
Resources (CZI.AX) owns the large, low-grade West Musgrave
nickel-copper project in Western Australia. It was introduced to the TSI
readership and discussed in some detail only two weeks ago (in the 19th
October Interim Update), so no update is required.
*Dragon
Mining (DRA.AX), a junior gold producer with operations in
Finland and Sweden, has been in the SSWL for more than two years. It has a
very low enterprise value (A$16M at a share price of A$0.30) relative to
its assets, but its future is largely dependent on being able to get the
necessary environmental permits for its Faboliden gold project in northern
Sweden. We think that environmental permitting is a serious risk for this
company.
An environmental permit for test mining at Faboliden is
currently being assessed by the relevant authorities, with a response
expected in the near future.
*Emmerson Resources
(ERM.AX) has just reported another batch of exceptional drilling
results from its Edna Beryl mine, which is part of the company's Tennant
Creek Mineral Field (TCMF) in Australia's Northern Territory. Evolution
Mining (EVN.AX), ERM's JV partner, WILL eventually buy ERM if exploration
of the TCMF continues to yield positive results.
ERM's stock price
is up by around 300% since the company was introduced at TSI at the end of
May. Over the same period the HUI is up by about 5%. There is plenty of
additional upside potential in ERM, but the risk is much larger now by
virtue of the increase in the market cap.
Anyone who was a buyer of
this stock at around the time it was introduced at TSI should probably
take partial profits if they haven't already done so.
*Focus
Ventures (FCV.V) owns the Bayovar phosphate (fertiliser) project
in northern Peru. Based on the updated PFS completed in Q2-2016, this
project is estimated to have an after-tax NPV(7.5%) of US$458M.
For there to be a large increase in FCV's stock price, one of two things
will have to happen. The company will have to attract a JV partner of
sufficient size and financial resources to fund the development of the
project or there will have to be a substantial rise in the speculative
enthusiasm for fertiliser-related equities. Currently, there is almost no
interest in such stocks.
Also worth mentioning is that FCV has
about C$1.1M of short-term liabilities and only about $0.6M of cash, so
unless it attracts a financially-strong JV partner in the near future it
will have to do another dilutive equity financing.
With a market
cap of less than US$7M and 100% ownership of a project with a US$458M NPV,
FCV has massive upside potential. However, in the absence of unexpected
news the stock probably won't do much over the next few months and could
soon be weighed down by an equity financing.
*Rio
Novo Gold (RN.TO) was added to the SSWL only 6 weeks ago (in the
26th September Weekly Update). Despite the excellent value offered by its
Feasibility-stage gold project in Brazil, we wrote at the time that we
weren't interested in buying the stock due to the company's cash shortage.
The company needs to do an equity financing and could be worth buying
-- on a small scale -- AFTER the financing has been arranged.
*Sarama Resources (SWA.V), a micro-cap gold miner
involved in a JV with Acacia Mining at an exploration-stage gold project
in Burkina Faso, rose by enough in July to create an excellent selling
opportunity (during a 2-week period in July the stock price rose from
C$0.20 to more than C$0.60). The price has since dropped all the way back
to the low-C$0.20s, where the market cap (around US$17M, based on 112M
shares outstanding) is low relative to the potential value of the asset
being developed and where patient speculators could consider doing some
buying.
Chart Sources
Charts appearing in today's commentary
are courtesy of:
http://stockcharts.com/index.html
![]()