![]()
![]()
![]()
![]()
- Interim Update 2nd December 2015
Copyright
Reminder
The commentaries that appear at TSI
may not be distributed, in full or in part, without our written permission.
In particular, please note that the posting of extracts from TSI commentaries
at other web sites or providing links to TSI commentaries at other web
sites (for example, at discussion boards) without our written permission
is prohibited.
We reserve the right to immediately
terminate the subscription of any TSI subscriber who distributes the TSI
commentaries without our written permission.
The US manufacturing
sector throws a spanner into the works
The ISM Manufacturing New Orders
Index is not the best leading indicator of US recession. That honour belongs to
Real Gross Private Domestic Investment (RGPDI). However, the New Orders Index is
a good indicator and it has the advantage of being reported monthly, whereas
RGPDI is reported quarterly. The latest update of the ISM Manufacturing New
Orders Index happened on Tuesday 1st December and revealed that the US economy
is on the verge of a recession. The relevant chart is displayed below.
A decline in the New Orders Index to lower than 48 is a reliable, although not
infallible, signal that the US economy is about to enter a recession. The latest
report shows that the Index is still above the recession line, but only just.
The New Orders Index for November came in at 48.9, which is the lowest since the
reading of 48.4 in August-2012 and the second-lowest reading since May-2009.
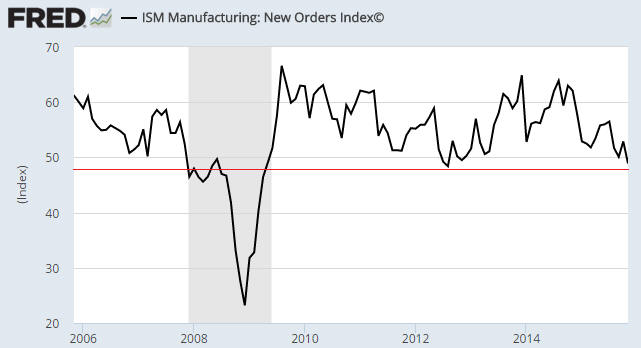
If the US economy is about to enter recession territory then the New Orders
Index should move well below 48 in December or January. Alternatively, a quick
rebound to the low-50s would suggest that, as was the case in 2012, a recession
had been narrowly avoided.
A recession signal from the ISM New Orders Index would skew the probabilities
back in favour of the 'equity bear market' scenario and would suggest that
gold's true fundamentals were about to turn definitively bullish. We stress,
however, that there is no signal yet.
Will the weak report on US manufacturing discourage the Fed from commencing a
rate-hiking program later this month?
Probably not. Despite the enviable track record of the ISM data set, the Fed
doesn't pay much attention to it. Rather, when it comes to economic statistics
the Fed prefers data related to the employment situation, even though the
employment numbers are almost completely useless as indicators of current or
future economic performance. For example, due to its undue focus on
employment-related data, the US economy was at least 8 months into the 2007-2009
recession before the Fed realised that a recession was underway. Clearly, one of
the Fed's most important guidelines is: "Do not be influenced by past failures;
instead, always assume that your models are correct, even if they never work in
reality." As an aside, this guideline has obviously been adopted by the climate
science profession.
So, unless the Employment Report scheduled for this Friday turns out to be
shockingly bad, a December rate hike will remain a good bet. This creates the
possibility that for the first time in history the Fed will be starting a
rate-hiking program near the start of a recession.
The Stock Market
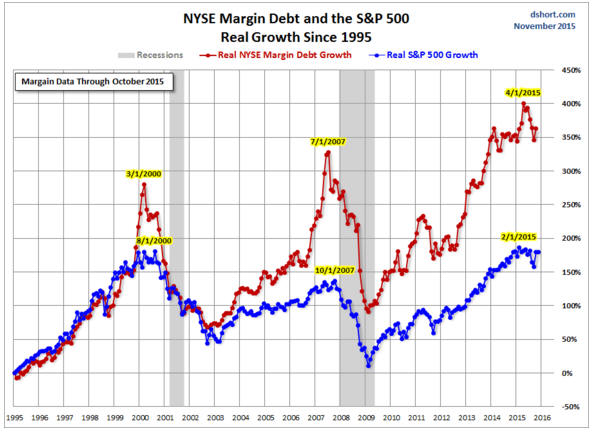
The US
Margin Debt remains consistent with the start of a bear market
As we've said many times in the past, leverage is bullish for asset prices as
long as it continues to increase, regardless of how far into 'nosebleed
territory' it moves. It's only after market participants begin to scale-back
their collective leverage that asset prices come under substantial and sustained
pressure. That's why the pronounced downturn in NYSE Margin Debt from its
April-2015 all-time high is a bearish sign. It is an important part of the
argument that a US equity bear market got underway in July -- an argument that
has been weakened, but not negated, by recent price action.
The reversal in NYSE Margin Debt from its April-2015 high is illustrated by the
following chart from Doug
Short. Despite October's small rebound, this year's Margin-Debt reversal
still looks similar to the reversals that occurred in early-2000 and mid-2007.
To maintain the similarity with the major reversals of 2000 and 2007, NYSE
Margin Debt must break below its September-2015 low within the next few months.
If it doesn't and instead moves back to near its April-2015 peak it will
indicate that the equity bull market is probably going to extend into the second
half of 2016.
Current Market Situation
Over the past few days there has been no movement of significance in any of the
senior US stock indices (the SPX, the NDX and the Dow Industrials), but the Dow
Transportation Average (TRAN) has dropped quite sharply and is again threatening
to break below support at 8000. TRAN, the weakest of the important US stock
indices and the leader to the downside over the past year, must achieve a solid
close below this support to warn of short-term trouble for the overall market.
Alternatively, if TRAN is able to achieve a solid daily close above 8350 at some
point over the weeks ahead it would be a virtual 'all clear' signal for the
overall market (with regard to the short-term outlook).
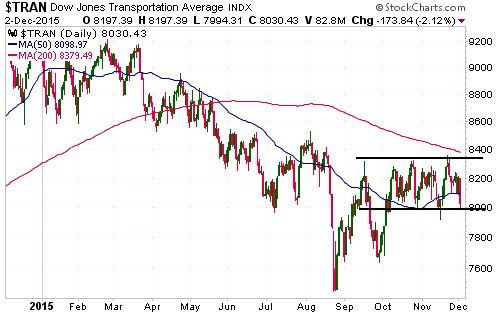
As noted in TSI commentaries earlier this year, TRAN's weakness is largely due
to weakness in railroad stocks, which, in turn, is related to the decline in the
oil price and the resultant reduction in spending by companies in the oil
business. It's therefore not a fluke that the quick drop by TRAN over the past
few days happened in parallel with a quick drop in the oil price.
The oil price has fallen back to $40, which means that it is now only $2 above
its 24th August bear-market low. What happens over the days immediately ahead
will be strongly influenced by the OPEC meeting that will take place on Friday
4th December. It is tempting to assume that the bearish case (no reduction in
OPEC oil supply) has been factored into the current price, but, unlike the
metals markets, there is no evidence in the COT data of speculative capitulation
in the oil market.
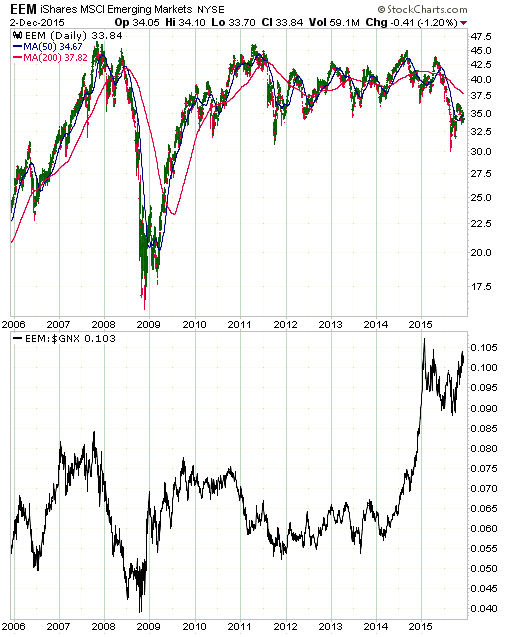
The Emerging Markets
In the latest Weekly Update, we wrote:
"...it occurs to us that although sentiment towards the "emerging markets"
appears to be very bearish, EEM has held up fairly well in nominal dollar terms
and extremely well in terms of the average commodity. This suggests that there
is a lot more remaining downside risk in emerging-market equities than there is
in commodity prices and that a bearish EEM speculation could be a reasonable
hedge for investors with sizable long-term exposure to commodity-related
equities."
By way of further explanation, here is a 10-year chart showing EEM in nominal
US$ terms and relative to the Goldman Sachs Spot Commodity Index (GNX). In
dollar terms EEM is well down from its peak of the past few years, but it
certainly hasn't collapsed. In commodity (GNX) terms, EEM appears to be much
closer to a long-term bull-market high than a significant low. In other words,
EEM appears to be very expensive relative to a basket of commodities.
Given the link between the commodity price trend and the emerging-markets equity
trend, we get the impression that either commodity prices (as represented by GNX)
are far too cheap or EEM is far too expensive. Hence our comment that a bearish
EEM speculation -- perhaps via put options with an exercise price of $25 and an
expiry date of June-2016 or later -- could be a reasonable hedge for investors
with sizable long-term exposure to commodity-related equities.
We currently don't intend to add an EEM put-option position to the TSI List, but
we have begun to build such a position in our own account.
Gold and the Dollar
Gold
So far this week, the gold price has fallen a little further and the bullish
divergence between the bullion market and the gold-mining sector has become
slightly more pronounced. The bullish divergence (or non-confirmation) has
become more pronounced because the US$ gold price made a new closing low on
Wednesday 2nd December while the HUI stayed comfortably above its September low.
As we write, gold is trading in the mid-$1040s in Asia. This is below the bottom
of the channel drawn on the chart included in the latest Weekly Update, but it's
the daily close in US trading that matters. It also matters whether or not the
gold-mining sector continues to hold above its September low and strengthen
relative to gold.
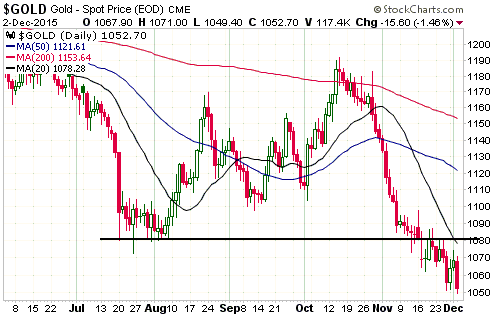
As stated in the latest Weekly Update, what we currently have is a gold market
that is 'oversold' and in which sentiment is constructive, as primarily
indicated by the COT data. What we don't have, yet, is evidence of a price
reversal.
It's still the case that a daily close above $1080 would be a preliminary sign
of an upward reversal in the short-term price trend.
On a separate matter, there's a better than 50% probability that at some point
over the next three months the Dollar Index will break decisively above its
March-2015 peak. While US$ strength is bearish for gold more often than not,
there are times when it is bullish. Those times are when the US dollar's
strength is mainly the result of plunging confidence in the euro. For example,
from mid-December of 2014 through to late-January of 2015 the US$ gold price
rose by more than $100/oz in parallel with an 8-point surge in the Dollar Index,
as fear/uncertainty about what the ECB was going to do boosted the demand for
both gold and the US$.
Always keep in mind that a) gold's relative value is driven by confidence in the
senior currency, with higher confidence leading to a lower gold value and lower
confidence leading to a higher gold value, and b) there are now two senior
currencies.
Gold Stocks
The HUI broke above near-term resistance at 113 on Tuesday and even though it
failed to sustain the breakout on Wednesday it has been holding up well
considering gold's price action.
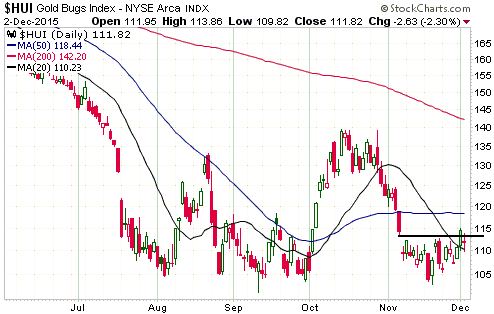
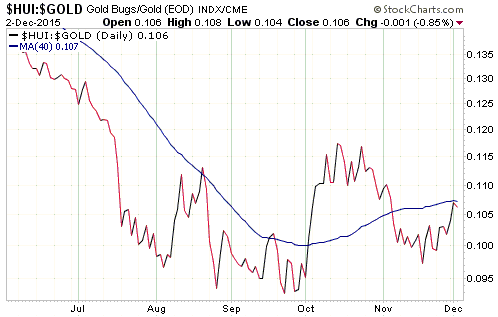
Due to the HUI's recent resilience in the face of new lows in the US$ gold
price, the HUI/gold ratio held above its September low in November and has just
moved up to the vicinity of its 40-day MA. A break above this MA would be a
short-term bullish signal.
As mentioned in the latest Weekly Update, we are doing very little with regard
to our gold-stock exposure as we wait for evidence of trend reversals in the
bullion market and the gold-mining indices.
The Currency Market
There are two events over the final two days of this week with the potential to
cause volatility in the currency market.
The first is the ECB meeting, the outcome of which will be known a few hours
after we post this Interim Update. Almost everyone expects the ECB to announce
additional monetary stimulus measures, thus proving that Mario Draghi's idiocy
knows no bounds. However, there is much uncertainty regarding the specific
details of the ECB's additional measures.
The second event with market-moving potential is the monthly US employment
report scheduled for Friday morning (US time). Although many speculators will
buy or sell the US$ in reaction to the specific details of this report, it will
probably take a shockingly-bad number to cause the Fed to change its plan for a
December rate hike. In other words, it's a good bet that the Fed will remain on
track for a December rate hike unless the employment numbers are terrible.
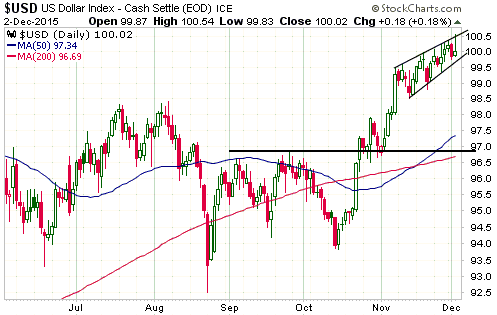
As illustrated below, the Dollar Index continues to trade within a "rising
wedge" pattern. Notice that Wednesday's price action involved a spike up to the
top of the 'wedge' followed by a pullback that retraced most of the day's gain.
It would now only take a daily close below 99.5 to effect a downside breakout
from the 4-week pattern. If this happens it will suggest a downside target of
around 97.
An upside breakout from the 'wedge' is possible, but less likely.
Updates on Stock Selections
Notes: 1) To review the complete list of current TSI stock selections, logon at
http://www.speculative-investor.com/new/market_logon.asp
and then click on "Stock Selections" in the menu. When at the Stock
Selections page, click on a stock's symbol to bring-up an archive of
our comments on the stock in question. 2) The Small Stock Watch List is
located at http://www.speculative-investor.com/new/smallstockwatch.html
Chart Sources
Charts appearing in today's commentary
are courtesy of:
http://stockcharts.com/index.html
http://research.stlouisfed.org/
![]()