![]()
![]()
![]()
![]()
- Interim Update 3rd January 2018
Copyright
Reminder
The commentaries that appear at TSI
may not be distributed, in full or in part, without our written permission.
In particular, please note that the posting of extracts from TSI commentaries
at other web sites or providing links to TSI commentaries at other web
sites (for example, at discussion boards) without our written permission
is prohibited.
We reserve the right to immediately
terminate the subscription of any TSI subscriber who distributes the TSI
commentaries without our written permission.
Happy New Year!
I wish you the very best of luck
in 2018 and thank you for supporting TSI.
US Recession
Watch
The latest iteration of the
monthly ISM Manufacturing New Orders Index (NOI) was reported on Wednesday
3rd January. The NOI is one the three leading indicators of US recession
that we care about, the others being Real Gross Private Domestic
Investment (RGPDI) and the yield curve.
The following chart shows
that the NOI rose sharply to a 14-year high in December-2017.
Based on the overarching message from our favourite leading
indicators, over the past three months our conclusion was that there would
be no US recession until Q2-2018 or later. That's still our general
conclusion, although in response to recent developments we can be a little
more specific.
Taking into account the NOI surge (bullish), the
fact that the yield curve is still in a flattening trend (bullish) and the
decline in the monetary inflation rate (bearish), we think that:
a)
The probability that a US recession will start in Q1-2018 is 0%.
b)
The probability that a US recession will start in Q2-2018 is 10%.
c) The probability that a US recession will start in Q3-2018 is 30%.
d) The probability that a US recession will start in Q4-2018 is 50%.
Apart from the 0% probability for Q1, it's likely that the percentages
mentioned above will change as new information becomes available.
The Stock Market
Low volatility across
the financial world
Stock market volatility in the US
wasn't just low last year, it was the lowest since the birth of the
current monetary system in 1971. This is evidenced by the unprecedented
amount of time spent by the VIX below 10. It is also evidenced by these
interesting facts:
a) The SPX's average daily change in 2017 was
the smallest since 1964.
b) Although the SPX enjoyed a substantial
(22%) rise over the course of 2017 there wasn't a single trading day with
an SPX gain of more than 1.4%.
c) On a daily closing basis the SPX
has not experienced a correction with a peak-to-trough decline of more
than 3% since November of 2016. Never before has there been such a long
stretch without a decline of more than 3%.
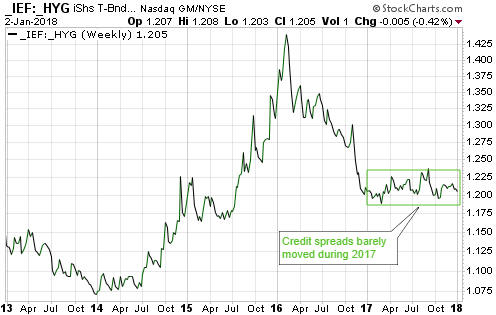
Furthermore, the absence
of volatility wasn't restricted to the stock market. As illustrated by the
following two charts, it spread across the financial world.
The
first chart shows that the IEF/HYG ratio, a credit-spread indicator, moved
sideways within a narrow range throughout 2017. Considering the economic
and financial-market instability caused by today's monetary system, such
performance is highly unusual.
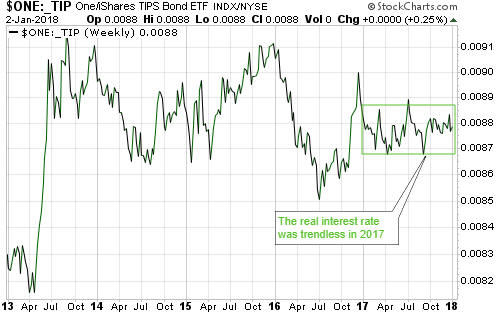
The second chart shows the
reciprocal of the iShares TIPS Bond Fund (TIP), an indicator of what's
happening to real interest rates. This indicator was choppy within a
horizontal range during the whole of 2017 and essentially flat-lined
during the final quarter of the year.
The credit spread and the
real interest rate are inputs to our gold and our equity
fundamentals-focused models. The choppy sideways movement of these inputs
is the main reason that our models have 'whipsawed' over the recent past.
From our perspective, the lack of volatility was one of last year's
biggest surprises. A repeat performance would be an even bigger surprise.
Current Market Situation
At no time over the
past 12 months did it seem that an end to the long-term equity bull market
was imminent. That's still the case, because financial-system leverage is
still on the rise. However, there were a few occasions over the past year
when we thought that a bearish speculation, in anticipation of a 10%+
correction, was appropriate. None of these speculations worked.
Humbled but not daunted by last year's failures we are now interested in
positioning ourselves for a meaningful downward correction during the
first quarter of this year. In fact, the lack of a correction worthy of
the name and the almost total absence of volatility during 2017 make it
even more likely that 2018 will contain greater-than-average two-way
volatility in the US stock market, beginning in Q1.
In the Weekly
Update posted on Sunday we wrote that ideally the NDX would surge to a new
high during the first week of the New Year to create the opportunity we
seek to get positioned in QQQ April-2018 $150 puts. We also wrote that for
those who prefer to avoid options trading it could make sense to average
into a QID (ProShares UltraShort QQQ) trading position.
The
following chart shows that a start-of-the-year surge to a new high has
happened. This, of course, doesn't mean that the market is close to even a
short-term top, but we argue that it reduces the risk of speculating
bearishly by potentially completing a short-term pattern that did not
appear to be complete at the end of December.
For our own account an initial position in the aforementioned puts was
taken on Wednesday 3rd January, as much to hedge our exposure to non-gold
stocks* as to bet on an NDX decline. However, we won't add a new bearish
speculation to the TSI List until there is a downward reversal in the
market, because at that time risk management will become more
straightforward. Specifically, after a downward reversal has happened it
will be possible to limit the risk of loss by placing a protective stop
slightly above the recent high.
*Gold
stocks are more likely to be helped than hurt by a sizable correction in
the broad stock market.
Gold and the Dollar
Gold
The
US$ gold price has risen for 9 days in a row and on 13 of the past 14
days. Needless to say, the market is 'overbought' on a short-term basis.
A routine 1-2 week correction should begin soon. It's possible that
former resistance at $1300 will act as a floor during the coming
correction, but a pullback to as far as the 50-day MA would be normal. As
indicated by the following chart, the 50-day MA is in the high-$1270s. It
is also rising and will soon be above $1280.
Silver
Like the US$ gold price, the US$ silver
price has moved upward in almost a straight line over the past 3 weeks.
The difference is that whereas the US$ gold price has broken above its
October-November highs, the US$ silver price has not yet reached
resistance defined by these highs.
Silver has short-term resistance
in the $17.25-$17.50 range. A test of this resistance followed by a
pullback to around $16.50 would set the stage for a move up to the more
important resistance at $18.00-$18.50.
Gold Stocks
On Tuesday of this week the HUI
became the last of the gold-mining indices and ETFs to break above the
200-day MA. It then pulled back on Wednesday while holding its breakout.
However, the break above the 200-day MA has occurred with the market
stretched to the upside on a short-term basis. Therefore, it probably
won't be sustained. Instead, it's reasonable to expect that a correction
over the coming 1-2 weeks will take the HUI back below its 200-day MA and
down to the vicinity of its 50-day MA (the blue line on the following
chart).
There has not yet been sufficient strength in the HUI/gold
ratio to suggest that an intermediate-term rally is underway, but even if
it isn't the gold-mining sector probably will move above this week's high
after some 'corrective' activity. In other words, the rally from the
December low is probably about to pause for breath, not come to an end.
The Currency Market
Oil, the Yuan and the dollar-based monetary system
Some
commentators have made a big deal over the Yuan-denominated oil futures
contract that will soon begin trading in Shanghai, but in terms of effect
on the global currency market this appears to be a very small deal.
With or without a Yuan-denominated oil futures market there is nothing
preventing the suppliers of oil to China from accepting payment in Yuan.
In fact, some of the oil imported by China is already paid for in Yuan.
Having a Yuan-denominated oil futures contract may encourage some
additional oil trading to be done in China's currency because it would
enable suppliers to reduce their risk via hedging, but the main issue is
that the Yuan is not a useful currency outside China. Unless an
international oil exporter was interested in making a large investment in
China, getting paid in Yuan would create a problem of what to do with the
Yuan.
In any case, the monetary value of the world's daily oil
consumption is less than 0.1% of daily trading volume on the foreign
exchange market, and the foreign exchange market is dominated by the US$.
Despite the popular (in some quarters) notion that the US$ is in danger of
losing its leading role within the monetary system, at last count the US$
was on one side of 88% of all international transactions. The euro, the
world's other senior fiat currency, was at around 30% (and falling). The
Yuan's share of the global currency market is very small (less than 3%),
and according to the following chart could be in a declining trend.
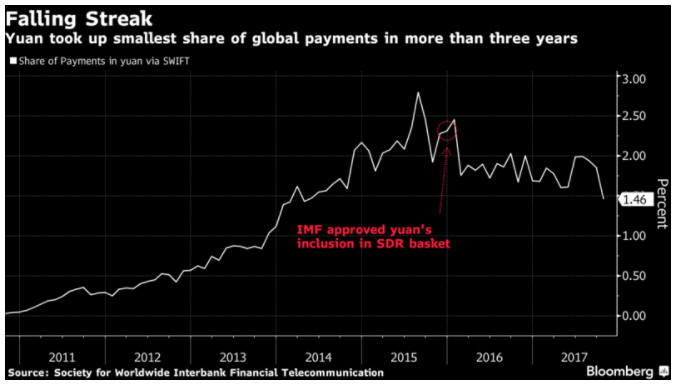
The point we were trying to make in the above paragraph is that a
change in how any country pays for its oil imports will not have a big
effect on the global currency market. Actually, the cause-effect works the
other way around. The pricing of oil in US dollars is not, or at least is
no longer, even a small part of the reason that the US$ dominates the
global currency system, but the fact that the US$ dominates the global
currency system causes most international oil exporters to demand payment
in US dollars.
The US$ sometimes rises and sometimes falls in value
relative to other currencies, but it always dominates global money flows.
Like it or not, that's the nature of today's monetary system.
The
current monetary system is US$-based and in all likelihood will remain so
until it collapses and gets replaced by something different. In other
words, it's unlikely -- we almost would go as far as to say impossible --
for the current system to persist while another currency gradually
superseded the US$. The reason is that there is no viable alternative to
the US$ among today's other major fiat currencies.
We don't have a
strong opinion on what the post-collapse "something different" will be.
One possibility is a system based on gold, but there could also be an
attempt to create a global fiat currency. The world's political leadership
and financial establishment would certainly favour the latter possibility,
but we fail to see how it could work as it would essentially be the
botched euro experiment on a much grander scale.
Current Market Situation
The euro
broke out to the downside in late-October, but in early-November it
reversed course and began to trend upward. This painted the downside
breakout as false.
Over the first two trading days of the New Year
it returned to its September peak before pulling back a little. A 1-2 week
consolidation is likely and would reduce the probability of a false upside
breakout.
Updates on Stock Selections
Notes: 1) To review the complete list of current TSI stock selections, logon at
http://www.speculative-investor.com/new/market_logon.asp
and then click on "Stock Selections" in the menu. When at the Stock
Selections page, click on a stock's symbol to bring-up an archive of
our comments on the stock in question. 2) The Small Stock Watch List is
located at http://www.speculative-investor.com/new/smallstockwatch.html
Chart Sources
Charts appearing in today's commentary
are courtesy of:
http://stockcharts.com/index.html
http://www.bloomberg.com/
![]()