|
- Interim Update 3rd March 2004
Copyright
Reminder
The commentaries that appear at TSI
may not be distributed, in full or in part, without our written permission.
In particular, please note that the posting of extracts from TSI commentaries
at other web sites or providing links to TSI commentaries at other web
sites (for example, at discussion boards) without our written permission
is prohibited.
We reserve the right to immediately
terminate the subscription of any TSI subscriber who distributes the TSI
commentaries without our written permission.
The problem
with Fannie and Freddie
In a recent speech Alan Greenspan expressed
concern about the way Fannie Mae and Freddie Mac are taking advantage of
an implied government guarantee to expand their balance sheets at a phenomenal
pace. According to Greenspan, the ability of these Government Sponsored
Enterprises (GSEs) to borrow money at below the market rate is allowing
them to rapidly increase their size and power without providing any significant
benefits to homebuyers.
In our opinion, it is more than a little
disingenuous of Greenspan to call for the GSEs to be 'reined in' because
the GSEs have been the main vehicles via which Fed monetary policy has
been implemented over the past several years. In particular, the balance
sheet expansion of the GSEs has been the main engine of money-supply growth
(inflation).
The Fed relies on institutions such
as Fannie and Freddie because the Fed, itself, makes almost no direct contribution
to money supply growth. For example, when the total supply of money (M3)
increases it is not because the Fed has printed more money, it is because
the total amount of debt has increased; and the biggest facilitators of
US$ debt creation over the past six years have been the GSEs.
So, given how helpful the GSEs have
been in furthering the Fed's inflation agenda why is Greenspan now expressing
concerns about their growth?
We can think of a few possible reasons,
one being that Greenspan wants to have more control over WHEN the GSEs
ramp-up their balance sheets rather than just having them expand at the
fastest possible rate at all times. After all, there is going to come a
time when the Fed will want to temporarily STOP promoting credit expansion.
Another is that Greenspan is not really interested in doing anything
to restrict the GSEs but wants to make sure he is on the record as having
provided a timely warning at that point in future when a major problem
occurs. A third possibility is that Greenspan is genuinely concerned about
one or more of the GSEs becoming insolvent due to a sharp rise in interest
rates and is paving the way for some preemptive action.
The GSEs' extensive use of derivatives
to manage their interest-rate exposure gets a lot of press, but we doubt
that derivatives will turn out to be the biggest problem. Instead, if Greenspan
is genuinely concerned about the GSEs' ability to cope with higher interest
rates it is most likely because their assets -- the mortgages and other
debt instruments they hold on their balance sheets -- are huge in relation
to their shareholders' equity and their provisions for losses. For example,
about six months ago we read that Fannie Mae had about $1 of loss reserves
for every $2,500 of its business exposure. Fannie's management justifies
such a small loss reserve on the basis that credit-related losses over
the past few years have been very small. The thing is, the losses have
only been small because interest rates have been trending lower and credit
has been expanding at a rapid clip. However, if the monetary backdrop changes,
as eventually it must, then these loss reserves are going to be woefully
inadequate.
In any case, regardless of whether
or not Greenspan means what he says when he expresses concern about the
GSEs' growth it is extremely unlikely that any restraints will be placed
on the GSEs over the remainder of this year. This is an election year,
after all.
The US
Stock Market
The Primary Trend
Is the stock market immersed in a secular
bear market? Possibly (a good argument can certainly be made that it is),
but not definitely. If a secular bear market in US equities did commence
during 1998-2000 then it appears to be proceeding in a similar way to either
the secular bear of 1966-1982 or the long-term bear market in Japan that
started in 1990 and perhaps ended last year.
The other possibility that we've addressed
at TSI over the past year is that a secular bear market has not started
yet. Based on the performance of the advance-decline line over the past
4 years and the new all-time highs recently achieved by several important
market sectors, a good argument can also be made that this is the case.
What we do NOT think is possible is
that a major bear market ENDED at the October-2002 lows. There are a number
of reasons for this, including:
a) Bear markets are all about washing
away the excesses built-up during the preceding bull market, but many of
the excesses in the stock market and the economy were not eliminated during
the 2000-2002 downturn. In fact, the US credit bubble grew at a rapid rate
during this period and valuation levels have generally remained high.
b) Major bottoms occur after the public's
expectations of future returns become depressed, but during the final quarter
of 2002 the public was still anticipating above-average long-term returns
from the stock market (this, of course, is related to the persistently
high valuations).
c) You don't correct an 18-year bull
market with a 3-year bear market.
As far as most of our TSI recommendations
as well as our own trading/investing are concerned, though, it doesn't
make any difference whether a secular bear market has or hasn't begun because
the normal time frame for any trades we make/recommend is 3-12 months;
and during any 3-12 month period it is not unusual for the market to move
counter to its secular trend. Furthermore, this is particularly the case
when the secular trend is down.
As an aside, our readers would be well
advised to keep the above-mentioned time frame in mind when reading the
TSI commentaries and acting on any recommendation we make. In some cases
we'll note that a particular investment is suitable as a long-term (> 1
year) play and in other cases we might specifically mention something as
a short-term (0-3 month) trade, but our main objective is to catch large
swings in the markets that unfurl over 3-12 month periods. As such, although
we regularly make comments on what we see happening over the coming few
weeks the daily and weekly fluctuations in the markets are of little interest
to us except when these fluctuations are significant enough to affect our
longer-term views.
Current Market Situation
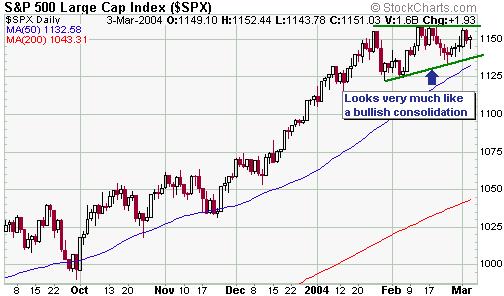
One of the challenges, at the moment,
is that there are more than the usual number of mixed signals. For example,
it looks like the S&P500 Index is immersed in a bullish consolidation
and that it is just a matter of time before we get a surge to new recovery
highs.
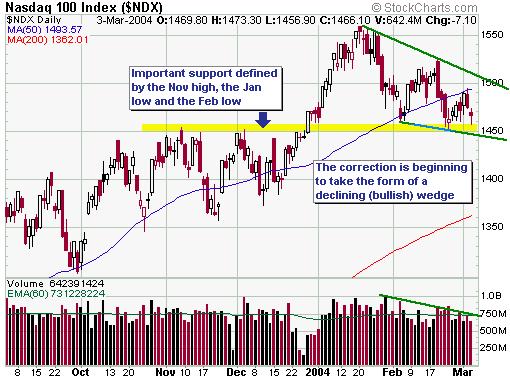
The NASDAQ100 Index, however, has been
considerably weaker, although important support held last week and the
pullback has recently started to look more like a declining wedge than
something more sinister.
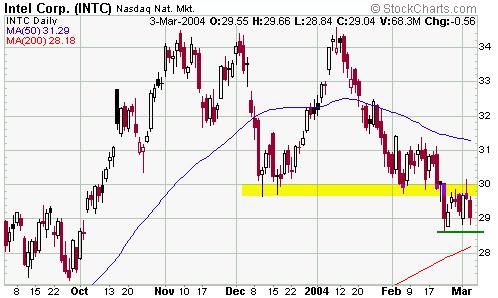
The short-term technical outlook for
the NASDAQ100 Index might have improved a bit over the past week but the
price action of Intel (NASDAQ: INTC) -- the world's largest semiconductor
company and probably the most important tech stock in the world at the
present time -- looks quite bearish. In particular: INTC broke below support
at the beginning of last week, rebounded back to that former support range
(now resistance) and then reversed lower.
Note, though, that Intel is scheduled
to give a mid-quarter business update after the market closes on Thursday
so things could change a lot between now and the end of the week depending
on what Intel's management has to say. A close above $30 at the end of
the week would, for example, suggest that a correction low was already
in place.
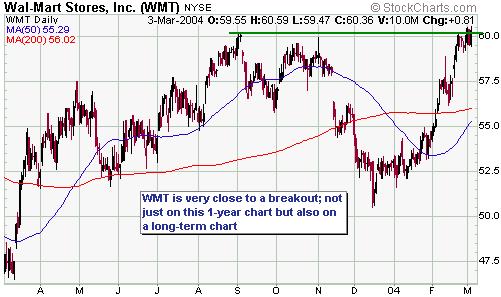
And while the stock price of Intel
has been breaking lower the stock price of Walmart (NYSE: WMT) -- a much
larger company than Intel -- has been very strong. WMT is now very close
to an important upside breakout on the 1-year chart shown below and also
on a long-term chart. In fact, a weekly close above $61 would suggest that
WMT's 4-year consolidation was over and that a major advance had begun.
Like we said: mixed signals.
Over the past couple of months our
expectation has been that there would be two peaks during the first half
of this year: a January peak followed by another -- most likely higher
-- peak during the March-May period. There is no change to this view, but
as mentioned over the past few weeks the relatively poor performance of
the NDX makes it likely that new recovery highs in the S&P500 and the
Dow over the coming months will not be confirmed by the tech-heavy NDX.
The biggest short-term risk
As mentioned in the e-mail alert sent
to subscribers on Tuesday, a big risk at the moment is the potential for
an upward spike in the oil price related, perhaps, to civil unrest in Venezuela.
The oil price has eased back over the past two days so the immediate threat
might have passed, but if something were to cause oil to move up through
long-term resistance in the $38-$40 range then there would almost certainly
be a large negative reaction in the stock market.
USPIX
We've received several e-mails over
the past two of weeks regarding the USPIX position in the TSI Stocks List
(USPIX is a fund designed to move by twice the INVERSE of the NASDAQ100
Index each day), so now is probably a good time to review our plans for
this position.
We keep stressing that the odds favour
new highs in some of the senior stock indices over the next few months,
so we are clearly not anticipating making any money from the USPIX position
in the short-term. In fact, we really don't want to make any money
out of USPIX right now because we are heavily net-LONG the market via our
gold and commodity stocks. As such, we currently consider USPIX to be a
small hedge against a much larger long position (it would help cushion
the blow if something dreadful and unexpected happened).
When we added USPIX to the Stocks List
back in December (refer to the 10th December Interim Update for details)
our thinking was that it would represent an initial position which
would be added to at the appropriate time(s) during the first half of 2004.
Our thinking has not changed.
We expect to add one or two more USPIX
positions to the TSI Stocks List over the next few months and to also scale-out
of long positions, thus giving our overall stance a far more bearish bias.
Once we add our second USPIX position we'll start following it more closely
and might employ a trailing sell-stop, but in the mean time we'd suggest
that your exposure to USPIX not be so large that you feel the need to check
its price more than once per week.
Gold and
the Dollar
Which is leading, gold or the CRB?
In commentary posted at http://goldmoney.com/en/commentary.php
James Turk argues that gold would normally be expected to lead the CRB
Index, but due to central bank management of the gold price it is presently
lagging the CRB. He concludes, therefore, that the recent surge in the
CRB Index is presaging a surge in the gold price.
Our interpretation is quite different,
however, because the following chart comparison of the gold price and the
CRB Index indicates that the current major advance in the gold price began
about 8 months before the current major advance in the CRB Index; in other
words, it is clear that gold led at the start of the bull run so it is
really quite a stretch to argue that it is now lagging. Furthermore, stock-market
action confirms gold's leadership role because when most commodity-cyclical
stocks were bottoming in October of 2002 the AMEX Gold BUGS Index had already
been in a bull market for about two years.
In our opinion there are two ways to
reasonably explain gold's recent weakness relative to the CRB Index, both
of which involve gold being in a leadership role.
One is that an important peak is already
in place in the gold market, meaning that the CRB Index will reach an important
peak of its own over the next few months. The other is that gold is experiencing
a normal correction to its upward trend and will move to new highs for
the year once the correction has run its course. In this case the gold-market
correction could be warning us to expect a significant pullback in the
CRB Index prior to a resumption of the CRB's upward trend.
The latter explanation looks more likely.
Current Market Situation
In last week's Interim Update we explained
why 118-119 looked like a reasonable downside target for the euro futures
over the coming few weeks. Furthermore, our expectations were that the
Dollar Index would move up to the 90-91 range. So, with March euro futures
trading as low as 120.5 on Wednesday and the Dollar Index hitting 90 there
isn't much additional downside risk in the euro and upside potential in
the Dollar Index if our analysis is roughly on-the-mark (as it sometimes
is).
Rather than further significant weakness
in the euro and strength in the Dollar, what will perhaps be required before
the corrective activity comes to an end is more time. Our guess
is that the euro will drop slightly below yesterday's low and the Dollar
Index will move slightly above yesterday's high at some stage over the
coming 4 weeks, but the important point is that the euro's risk/reward
now looks attractive as far as the coming 3 months are concerned.
The way we currently think this will
go -- bearing in mind that we'll make whatever adjustments we need to make
along the way to ensure that we don't get out of synch with the market
-- is that the Dollar Index will drop to a new bear-market low over the
next 3 months, but it will be trading ABOVE its current level by year-end.
In the latest recent commentaries we
mentioned that the repeated testing of support at $395 (basis the April
contract) by the gold market made it very probable that this support level
would be breached, creating a downside target of $380 (+/-$3). Support
at $395 has now given way with April gold closing below this level on each
of the past three sessions and trading as low as $388 on Wednesday.
Our view is that you might (probably
will) get the chance to buy gold a few dollars below yesterday's low within
the coming week or so, but you probably aren't going to get the chance
to buy it at considerably lower prices.
It's possible that gold will start
to move higher immediately, but we'd be skeptical of the staying power
of any rally that began from near current levels. In our opinion, gold
will have a much better chance of making it to new highs for the year if
it first cleans out more of the weak hands by dropping down to around 380.
Furthermore, if gold were to drop to around 380 while the HUI held above
its February low of 208 we would have a very clear signal that a large
advance in both the stocks and the metal was about to begin.
We've focused on the small picture
for gold over the past couple of weeks so it is now probably a good time
to step back and take another look at the longer-term picture. As such
we've included, below, a weekly chart of the gold price covering the past
three years. Note that the advance in the gold price remains orderly; however,
major moves in the gold market generally don't end with a whimper but rather
with a large upward spike.
The HUI had bounced off the 217 level
on four occasions over the past couple of weeks, making it likely that
this level was going to be breached before a secondary low was put in place
(we say a "secondary low" because we think the HUI bottomed in early February).
The HUI traded below 217 for a short while on Wednesday before reversing
sharply higher, opening up the possibility that we've just seen a successful
test of the early February low. If gold follows our script then the HUI
might trade below yesterday's low, but we doubt that anyone is going to
have an opportunity to buy gold stocks at considerably lower levels; at
least, not within the next three months (late this year might be a different
story).
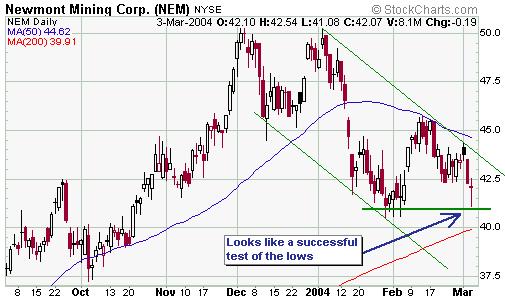
The performance of the Newmont Mining
stock price is probably more important than the performance of the HUI
at this time, and yesterday's intra-day plunge down to $41 by NEM sure
looked like a successful test of the lows (see chart below).
By the way: it might not seem this
way to anyone new to the world of gold stocks, but if we are right that
the lows for the HUI and many individual gold stocks were put in place
in early-February then this correction in the gold sector -- a correction
that we warned about repeatedly when the HUI was close to its highs in
December and January -- has been quite mild. This has probably been the
case because the overall stock market has remained reasonably firm. We
suspect that many holders of gold stocks don't view their gold stocks as
bets on a continuation of the bullish trend in the broad stock market,
but right now that's what they are. Gold stocks have been trending with
the stock market over the past 18 months and are likely to continue trending
with the stock market, although as explained many times in the past they
will probably remain strong for a few weeks after a major stock-market
peak is put in place.
Palladium
The current supply/demand picture for
palladium is quite bearish. As mentioned in a previous commentary we are,
however, long-term bullish on this metal. This is because we anticipate
a dramatic improvement in palladium's supply/demand situation over the
next few years.
Our reasoning, in a nutshell, is that
both palladium and platinum can be used in the manufacture of catalytic
converters (anti-pollution devices) for non-diesel car engines and that
there is currently an enormous gap between the prices of these two metals
(platinum is presently almost 4-times the price of palladium). This price
gap, in turn, will be a powerful incentive for car manufacturers to swap
from using platinum to using palladium when they re-tool for new models,
in the same way that an extremely high palladium price caused them to make
the opposite switch a few years ago.
The price-gap between palladium and
platinum could, of course, narrow as a result of a collapse in the platinum
price. However, while we are not bullish on platinum we doubt that there
will be a major (>30%) decline in its price because a sizeable drop in
price would bring-about an increase in the demand for platinum jewelry.
Therefore, the main impetus for a closing of the price gap over the next
few years is most likely going to come from a rising palladium price.
We don't do much technical analysis
of the palladium market and don't have any upside targets for palladium
as far as the coming 6-12 months are concerned. What we can say, though,
is that palladium appears to have less downside risk than any of
the metals we follow with the exception of gold. This is because its price
advance over the past 10 months has been very orderly (there is no sign
of an upside blow-off as there is with most of the other industrial metals)
and there is good support at $220 (less than 10% below the current price).
North American Palladium (AMEX: PAL,
TSX: PDL) was the one palladium play in the TSI Stocks List until we recently
decided to exit the stock after it doubled in a short space of time. Hopefully,
there will be an opportunity to re-enter PAL at a lower price during the
next several months.
Update
on Stock Selections
 A
good update on the progress of NovaGold (AMEX: NG, TSX: NG) can be read
at http://biz.yahoo.com/bw/040301/15616_1.html. Bear in mind, when reading
this, that the company's current enterprise value (market cap plus net
debt) is only about US$200M. A
good update on the progress of NovaGold (AMEX: NG, TSX: NG) can be read
at http://biz.yahoo.com/bw/040301/15616_1.html. Bear in mind, when reading
this, that the company's current enterprise value (market cap plus net
debt) is only about US$200M.
Afrikander
Lease (JSE: AFL, Pink Sheets: AFKDY), a leveraged play on gold and uranium,
has secured enough cash through the issue of more shares and debt to complete
the purchase of the Kalgold mine from Harmony Gold. This essentially means
that the short-term danger is over for Aflease. All we need now is an increase
in the Rand gold price (we think the Rand gold price has bottomed and will
work its way higher over the remainder of this year) and for the company
to complete the process of getting its shares off the horrible "Pink Sheets"
in the US and onto a proper market.
The
senior managers at Citigold (ASX: CTO), the company formerly known as Charters
Towers, made a monumental blunder towards the end of last year when they
decided to raise money by issuing high-yielding convertible notes rather
than doing a normal equity issue; and shareholders are still paying for
this mistake as well as for the delays in finalising the issue. However,
the shares are beginning to show some signs of having bottomed. This is
a high-risk stock, but one that should do very well from current levels
if the company is able to commence production in accordance with its current
schedule, that is, by the third quarter of this year.
We wouldn't, by the way, be buyers
of the convertible notes at their issue price of 40c.
As
mentioned in Tuesday's e-mail alert, we've exited the second half of the
Western Silver (TSX: WTC) position for a profit of about 280%.
Chart Sources
Charts appearing in today's commentary
are courtesy of:
http://stockcharts.com/index.html
http://www.futuresource.com/

|
