![]()
![]()
![]()
![]()
- Interim Update 3rd May 2017
Copyright
Reminder
The commentaries that appear at TSI
may not be distributed, in full or in part, without our written permission.
In particular, please note that the posting of extracts from TSI commentaries
at other web sites or providing links to TSI commentaries at other web
sites (for example, at discussion boards) without our written permission
is prohibited.
We reserve the right to immediately
terminate the subscription of any TSI subscriber who distributes the TSI
commentaries without our written permission.
Almost everything
commodity related is weakening
Commodity 'plays' in general,
including the industrial metals, oil, the commodity currencies and most
commodity-related equities, have been persistently, albeit not
dramatically, weak since February. In many cases important support levels
are being tested or have already been breached.
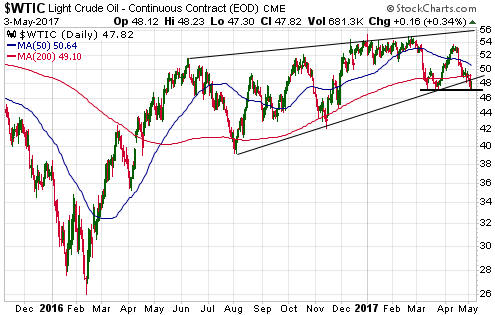
For example, the
oil price broke below intermediate-term trend-line support during the
first two days of this week and is now testing lateral support at $47. A
weekly close below $47 would eliminate any remaining doubt that an
intermediate-term decline is in progress.
For another example, it looks like copper is preparing to test
intermediate-term lateral support at $2.45.
For a third example, the Metals and Mining ETF (XME) broke below
intermediate-term lateral support at $29.00 on Wednesday 3rd May.
Commodity plays in general are also now short-term 'oversold'. This
probably means that interim lows will be put in place and 1-3 week
counter-trend rebounds will get underway within the coming few trading
days, but be aware that sharp declines could occur before these interim
lows are in place.
How
to know for sure that gold has commenced a cyclical bull market
We are almost alone among
long-term gold bulls in NOT believing that gold commenced a new cyclical
bull market in December-2015. Not that it really matters from a practical
perspective.
As we explained in a
recent blog post, while assertions to the effect that an investment is
in a bull or bear market can make for colourful commentary, in the real
worlds of trading and investing it's best not to get hung up on bull and
bear labels. For example, in January-2016 it wasn't necessary to believe
that a gold bull market was getting underway to determine that an
excellent opportunity to buy gold-mining stocks had arrived. All that was
required was objective, well-informed analysis of sentiment, price action
and inter-market relationships. It will be the same at the next excellent
buying opportunity.
That being said, there is a signal that always
gets generated in the early phase of a gold bull or bear market and that
generally doesn't get generated at other times. This signal can be used as
confirmation that a shift from bear to bull or bull to bear has happened.
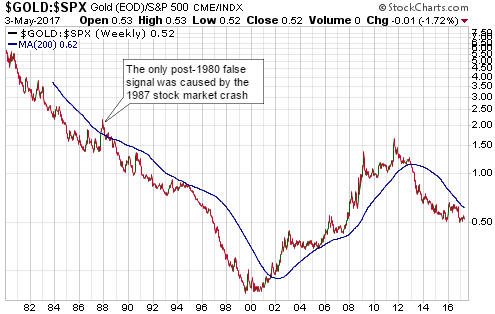
The signal is a cross by the gold/SPX ratio (the US$ gold price
divided by the S&P500 Index) from above to below or below to above its
200-week moving average (200WMA). Since the early-1970s and with only one
brief exception (in 1976), not long after the start of a gold bull market
the gold/SPX ratio has moved above its 200WMA and remained above it until
the bull market ended. Also, since the early-1970s and with only one brief
exception caused by the 1987 stock-market crash, not long after the start
of a gold bear market the gold/SPX ratio has moved below its 200WMA and
remained below it until the bear market ended. Putting it more succinctly,
over the past 45 years a 200WMA cross by the gold/SPX ratio has reliably
indicated the start of a new cyclical gold trend early enough in the new
trend to be useful.
The following weekly chart shows the gold/SPX
ratio and its 200WMA (the blue line) since 1980. The December-2015 low was
more than 16 months ago and yet gold/SPX remains comfortably below its
200WMA. This is not where it should be if a cyclical bull market began in
December-2015.
At some future time the gold/SPX ratio will move above its 200WMA.
Unless it does so as the result of a 1987-style stock-market crash, when
it happens it will be confirmation that gold has commenced a cyclical bull
market.
What is a correction?
"Correction" is a commonly-used
term in the financial markets, but it is also a vague and somewhat strange
term. It is vague because whether or not a market move is a correction is
a matter of both opinion and timescale. It is strange because it suggests
that the market price was wrong and had to be put right (corrected).
A correction involves retracing part (occasionally all) of a move that
occurred in the direction of the main trend, but it is only with the
benefit of hindsight that it can be known whether a price move was a
correction to an on-going trend or a new trend. In real time, stating that
a market has begun a correction will always be stating an opinion rather
than a fact. Also, a trending move in one timeframe will usually be a
correction in a larger timeframe, and vice versa. We'll use silver's price
action to further explain.
When the silver price began to decline from its early-April high it
could have been 'correcting' the rally that began in March, but due to the
price having dropped below its March low we now know that the 'corrective'
move was actually the rally that began in early-March and not the decline
from the early-April high. In fact, it could be said that everything
that's happened since the late-February high is part of a correction, but
even this would just be an opinion because it would be based on the
assumption that the overall upward trend from the December-2016 low did
not end in February-2017. This assumption might not be valid, in that the
rally from the December-2016 low could be nothing more than a 2-3 month
correction to the downward trend that began in July of last year. In other
words, the December-February rally could be an interruption to the
intermediate-term downward trend that began in July-2016 rather than the
start of a new intermediate-term upward trend, in which case the decline
from the February-2017 high constitutes the resumption of the
intermediate-term downward trend.
Stepping further back, the rally
from the December-2015 low to the July-2016 high could be a correction as
opposed to the first leg of a new major trend; that is, it could be a very
strong counter-trend rebound within a continuing bear market. At this
stage, stating that it was the first leg of a new bull market is stating
an opinion, not a fact. And it's an opinion that, in our opinion, is
probably wrong.
Always be aware when a commentator is stating an
opinion that could be wrong rather than a fact that, by definition, must
be right. In the world of financial-market punditry, a lot of statements
that are presented as facts are actually opinions.
The Stock Market
Sometimes it really is
different
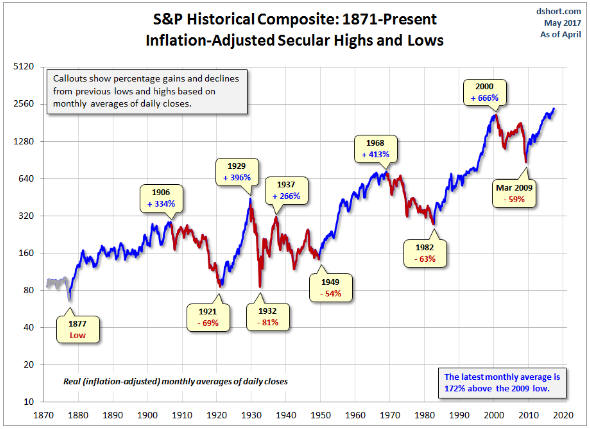
The following chart shows the
"inflation"-adjusted S&P from 1871 to the present, using monthly averages
of daily closing prices. We found the chart in the article posted
HERE. As explained in the article: "The implicit rule we're
following is that blue shows secular trends that lead to new all-time real
highs. Periods in between are secular bear markets, regardless of their
cyclical rallies. For example, the rally from 1932 to 1937, despite its
strength, remains a cycle in a secular bear market. At its peak in 1937,
the index was 29% below the real all-time high of 1929."
Due
to having reached new all-time highs in 'real' terms, the rally from the
March-2009 bottom is indicated on this chart to be a secular bull market.
The article doesn't specify how the inflation-adjusting was done, but
we assume that the CPI was used. If so, the 'real' gains during the
current cycle have been greatly magnified by virtue of US$ depreciation
being underestimated. Using our own method of inflation-adjusting, the
February-2017 high (the monthly closing high to date for the rally that
began in 2009) was below the October-2007 high, which, in turn, was below
the December-1999 high.
New all-time highs in inflation-adjusted
terms or not and a new secular bull market or not, the stock market rally
of the past several years has been extraordinary. Furthermore, it has been
different in one very important respect: it began at a much higher
valuation than any other comparable long-term rally in the US stock
market. Which goes to prove that the widely-ridiculed saying "it's
different this time" is sometimes correct.
The unprecedented
behaviour of central banks is the reason it has been different this time.
Here we are almost 8 years into a US economic expansion and the Fed is
still aggressively encouraging investors to take-on additional risk. And
compared to the ECB and the BOJ, the Fed looks downright prudent!
The Emerging Markets Equity ETF (EEM) refuses to buckle
Our bearish EEM speculation is not working. As illustrated below, EEM
made a new 12-month high during the first half of this week.
For emerging-market equities, the worst of all worlds involves
strength in the US$, weakness in the US stock market and weakness in
commodities. We expected that by now we'd have all three of these bearish
forces, but all we've currently got is the third one.
That being
said, we still like the bearish EEM trade, because we suspect that the US$
is only a few days from a bottom, that there is significant additional
price weakness in store for commodities, and that the US stock market is
not about to run away to the upside. Furthermore, EEM has established a
bearish momentum divergence over the past two months, with rising price
tops in parallel with declining tops in the daily RSI.
For new
money we would, however, prefer the September $35 EEM put options to the
June puts previously suggested. The June puts could still work, but the
probability of a substantial decline happening by mid-September is much
higher than the probability of a substantial decline happening within the
next 6 weeks.
Gold and the Dollar
Gold and Silver
On a short-term basis the silver market is now very 'oversold'. This
is evidenced by the price having fallen on 11 of the past 12 trading days
and by the daily RSI(14) shown at the bottom of the following chart. The
daily RSI's current level of 22 is unusually low. In fact, we have to go
back to 2014 to find a lower reading.
That the silver market is now
very 'oversold' should not, however, be construed to mean that a
sustainable low is not far away. We suspect that an interim low will be
put in place over the final two days of this week or the first half of
next week, but that the market is not yet close to what we would view as a
tradable low (a low that is followed by a multi-month rally).
As
mentioned in the Weekly Update, a sustainable/tradable price low probably
won't be in place until after at least half of the speculative bullish
positions in the futures market have been liquidated.

In the latest Weekly Update we wrote that we would take profits on our
silver hedges (SLV put options) if the silver price dropped to near its
March low of $16.80 this week. This happened on Monday, so our silver
hedges have been removed with a plan to establish a new hedge position
following a rebound.
Given that the silver price continued to
decline after we exited our SLV puts, our timing wasn't ideal. However, we
figured that with the silver/gold ratio even more 'oversold' than the US$
silver price (the daily RSI for the silver/gold ratio is at its
second-lowest level of the past 5 years), the only way the silver price
could extend its decline would be if the gold price fell sharply, in which
case our gold hedge position in the form of GLD put options would come to
life.
As illustrated below, the gold price broke below support at
$1260 on Monday 1st May and then followed through to the downside. This
means that gold bullion has finally acknowledged the warning signs that
the gold-mining sector has been flashing for some time.
Our guess is that gold, like silver, will reach an interim price low
within the coming few days.
Gold Stocks
After performing dismally relative to gold bullion over the preceding two
weeks, over the first three days of this week the HUI held up well in the
face of a downside breakout in the gold price. This is consistent with the
view that interim lows will soon be in place for gold and silver.
The HUI has support at 180 and then at 160. It looks like the higher of
these support levels will hold if tested in the near future, but we
suspect that the lower support will be breached before the start of the
next multi-month rally.
Recall the two short-term HUI scenarios mentioned last week. These
scenarios could be called "capitulation now" and "capitulation later", in
that one involves a capitulation within the next few days and the other
involves 1-2 months of back-and-forth price action between the March low
and the April high prior to a capitulation. Both scenarios remain in play,
although time has almost run out for the first one.
The
Currency Market
Since dropping to a marginal new low for
the year during the two trading days following the first round of the
French Presidential election, the Dollar Index has drifted in a narrow
range near its 200-day MA. This looks like a consolidation prior to what
we think will be a trend-ending downward spike.
A trend-ending
downward spike will potentially happen early next week if, as seems
extremely likely, Macron wins France's Presidential election run-off on
Sunday 7th May.
Updates on Stock Selections
Notes: 1) To review the complete list of current TSI stock selections, logon at
http://www.speculative-investor.com/new/market_logon.asp
and then click on "Stock Selections" in the menu. When at the Stock
Selections page, click on a stock's symbol to bring-up an archive of
our comments on the stock in question. 2) The Small Stock Watch List is
located at http://www.speculative-investor.com/new/smallstockwatch.html
Chart Sources
Charts appearing in today's commentary
are courtesy of:
http://stockcharts.com/index.html
![]()