![]()
![]()
![]()
![]()
- Interim Update 3rd June 2015
Copyright
Reminder
The commentaries that appear at TSI
may not be distributed, in full or in part, without our written permission.
In particular, please note that the posting of extracts from TSI commentaries
at other web sites or providing links to TSI commentaries at other web
sites (for example, at discussion boards) without our written permission
is prohibited.
We reserve the right to immediately
terminate the subscription of any TSI subscriber who distributes the TSI
commentaries without our written permission.
No sign of a US
recession, yet
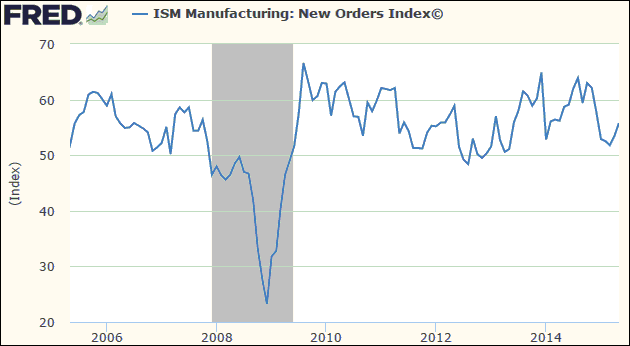
As we've noted in the past, it's
unlikely that an official US recession will begin until after the ISM (Institute
of Supply Management) New Orders Index has broken solidly below 50 (say, to 48
or lower). In March the Index was only marginally above 50, but in April it
ticked upward by a couple of points and the May figures released early this week
showed another up-tick of a couple of points.
The message of this reliable economic indicator is therefore unchanged from last
month. The US economy remains sluggish, but it isn't in immediate danger of
entering recession territory.
The Stock Market
The US
Valuation
With the exception of a 12-month period around the March-2000 stock market peak,
the Wilshire5000 Index, the broadest US equity index, is higher today relative
to US GDP than it has ever been. In particular, the Wilshire/GDP ratio is much
higher today than it was at the major peaks of 2007 and 1972. Refer to the
following chart for details. Given this fact, it's strange that there is an
on-going vigorous debate about whether or not the market is over-valued. We have
some sympathy for the view that an over-valued market can always become more so
and that a major top could therefore still be a considerable distance away, but
we have nothing but contempt for the view that the market is currently not
expensive.
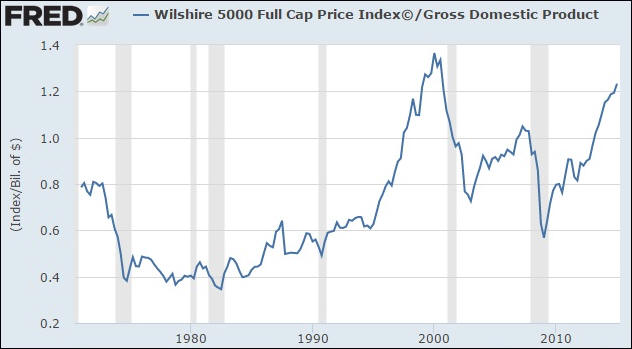
We've presented the above chart in previous commentaries, but there is an
interesting aspect of this chart that we haven't previously mentioned (because
we were too focused on the chart's market-valuation message to notice anything
else). We are referring to the fact that since 1970 the Wilshire/GDP ratio has
always peaked about two quarters prior to the start of an official recession.
For example, the most recent official recession began in December of 2007 and
the Wilshire/GDP ratio peaked in Q2-2007.
Now, the GDP numbers are issued quarterly, so the most recent point on the above
chart is for Q1-2015. When the Q2-2015 GDP number is published in July it will
possibly show that Q1-2015 was the peak for the ratio, but even in this
worst-case scenario the historical relationship would suggest that the start of
the next US recession was still a few months away.
Margin Debt and the Bull Market
Over the past year we've reported on the NYSE Margin Debt situation every 1-2
months. For many months it looked like a major margin-debt peak had been put in
place in February of 2014, but margin debt made a new all-time high in March.
Due to the lead-lag relationship between the long-term trends in margin debt and
the S&P500 Index, this suggested that the US equity bull market was still at
least a few months from its end.
Just to be clear, an unusually-high level of margin debt points to substantial
long-term downside risk, but in the past the shift from bull-market to
bear-market has followed the peak in margin debt by at least a few months. As
long as leverage is still increasing, as indicated by new highs in margin debt,
the end of the bull market probably isn't imminent.
The NYSE margin debt figures for a month are always reported about 4 weeks after
the end of the month, which is why it took until late last week to find out what
happened to this measure of leverage in April.
As illustrated by the following chart from the article posted
HERE, NYSE margin debt was sharply higher in April. This increases long-term
risk, but, paradoxically, reduces the probability that the bull market is ending
right now. As mentioned above, the reason is that the general leverage of market
participants is still expanding.
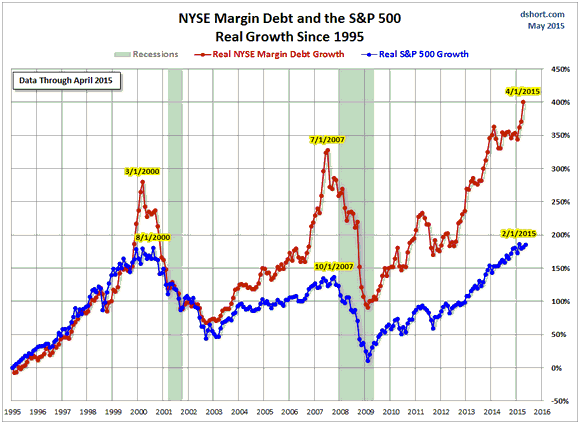
An additional multi-month extension of the US equity bull market involving a
shift in favour of commodity stocks continues to be one of the two
highest-probability intermediate-term scenarios. This scenario is consistent
with the April surge in margin debt. The second scenario is that we have just
witnessed the same type of short-lived breakout to new highs in senior stock
indices that marked major tops in 2000 and 2007.
If the second scenario is playing out then the S&P500 Index should not make a
new weekly closing high, that is, the S&P500 should not end a week above 2126,
from now on. At least, that's the 'stop' that we will be using for bearish
speculations in our own account. The S&P500 ended Wednesday's session at 2114,
so it would only take a minor amount of strength from here to prompt us to exit
our bearish US stock-market position -- a position that was averaged-into over
the past three weeks.
Gold and the Dollar
Gold
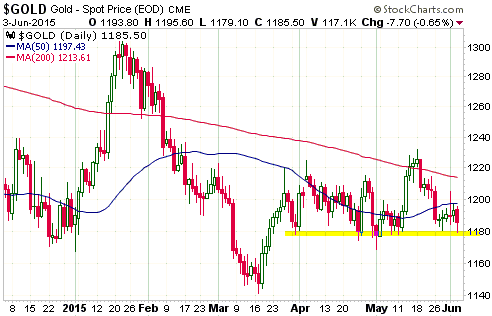
The first three trading days of this week provided nothing in the way of new
information about gold's short-term prospects. For example, gold rebounded to
$1200 early in the week, but, as noted in the latest Weekly Update, a rebound of
this magnitude would not be surprising even if gold had embarked on a short-term
downward trend. The gold price then reversed course, but has remained within the
narrow range of the past two months.
One of two things is almost certainly going to happen this month to 'break the
deadlock'. The gold price is either going to move solidly below support at $1180
and drop back to the vicinity of its November-2014 low, or it is going to move
solidly above $1220 and confirm that no further testing of the 2014 low will be
required. We are leaning towards the former outcome, but not with conviction.
The gold market might 'tip its hand' on Friday in the aftermath of the monthly
US Employment Report.
What is the probability that gold will break well below its 2014 low?
Such probabilities are always unknowable, but we will be surprised if it
happens. Here's why:
1) Gold's fundamentals are not bullish at this time, but they aren't bearish
either. They remain 'mixed, with some (the yield curve and the US dollar's
exchange rate) having recently become more bullish and others (real interest
rates and the banking sector's relative strength) having recently become more
bearish.
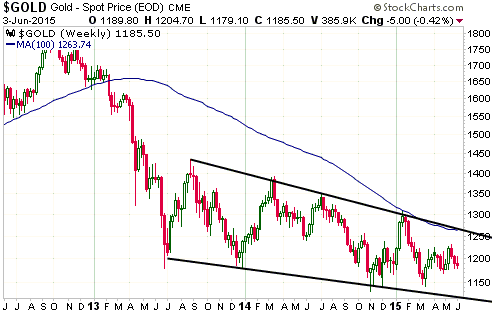
2) The price action since mid-2013 appears to be part of a long-term bottoming
pattern in the form of a wedge. Refer to the following weekly chart for details.
This pattern allows for a marginal new bear-market low prior to the start of the
next tradable rally, but it doesn't allow for a more bearish short-term outcome.
3) The sentiment backdrop, as indicated by the COT data, is currently neutral or
slightly-bullish for gold and bearish for silver, but if prices retreated to
their 2014 lows it would probably turn unequivocally bullish due to the
liquidation of speculative 'longs'.
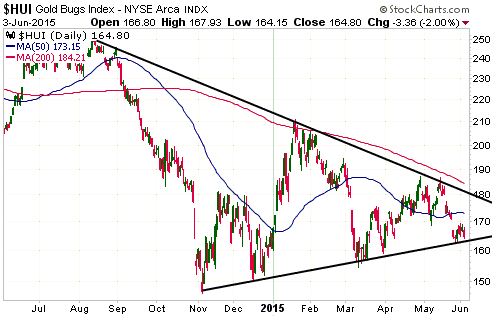
Gold Stocks
The HUI has done very little so far this week and remains slightly above
trend-line support in the low-160s. A break below this support, which could
happen in reaction to Friday's US employment data, would likely be followed by a
decline to the more important support that lies at 145-150.
Of course, a decline to 145-150 is not a foregone conclusion. It's possible, for
example, that support in the low-160s will continue to hold and that the next
move of significance will be higher.
As advised in the latest Weekly Update, we would now view a weekly close above
185 as a clear-cut sign that the HUI was going to avoid another test of its
November-2014 bottom.
The Currency Market
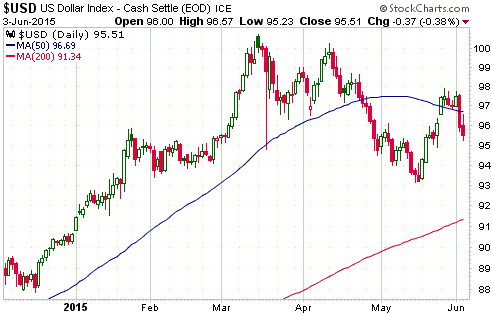
So far this week the currency market has mostly been about Greece. In
particular, the Dollar Index pulled back sharply over the past two days, but
this US$ decline was almost entirely due to strength in the euro on the back of
a growing belief that Greece and its official-sector creditors will soon do a
deal that maintains the status quo. In other words, the US dollar's weakness was
not broad-based.
We confess to being unable to find anything resembling logic in the
publicly-stated negotiating positions of either the Greek government or its
official-sector creditors.
The Greek government now appears to be aiming for a deal that continues the game
of "extend and pretend", after being committed to a more permanent and realistic
solution early this year. From our perspective it is holding almost all the
cards, in that it could simply default and stay in the monetary union. However,
it has been acting like it has a very weak hand.
For their part, the creditors are trying to make it as difficult as possible for
the Greek government to get access to additional financing, but the only reason
the Greek government needs additional financing is to pay the same creditors. In
effect, the creditors have been threatening to cut off the flow of money to
themselves. Putting it in more colourful terms, the negotiating position of the
Greek government's official-sector creditors appears to be: "If you refuse to
play ball, we will shoot ourselves in the foot!"
The financial markets are currently discounting more "extend and pretend" with
regard to Greece's government debt, which is why gold wasn't helped by the
decline in the Dollar Index over the past two trading days. Gold, the ultimate
safe haven, benefits from the perception of increasing problems with the
monetary and banking systems.
Updates on Stock Selections
Notes: 1) To review the complete list of current TSI stock selections, logon at
http://www.speculative-investor.com/new/market_logon.asp
and then click on "Stock Selections" in the menu. When at the Stock
Selections page, click on a stock's symbol to bring-up an archive of
our comments on the stock in question. 2) The Small Stock Watch List is
located at http://www.speculative-investor.com/new/smallstockwatch.html
Chart Sources
Charts appearing in today's commentary
are courtesy of:
http://stockcharts.com/index.html
http://research.stlouisfed.org/
![]()