![]()
![]()
![]()
![]()
- Interim Update 3rd June 2020
Copyright
Reminder
The commentaries that appear at TSI
may not be distributed, in full or in part, without our written permission.
In particular, please note that the posting of extracts from TSI commentaries
at other web sites or providing links to TSI commentaries at other web
sites (for example, at discussion boards) without our written permission
is prohibited.
We reserve the right to immediately
terminate the subscription of any TSI subscriber who distributes the TSI
commentaries without our written permission.
Global Monetary
Inflation Roundup
In most countries/regions, the
money-supply growth rate bottomed in 2019 and by the beginning of this
year was in a clear-cut upward trend. Then came the "coronacrisis",
involving widespread economic lockdowns and unprecedented central bank
money/credit creation designed to counteract the effects of the lockdowns.
A result was a veritable explosion in monetary inflation rates around the
world during March and April (April being the latest month for which there
is complete money-supply information). Here are some examples:
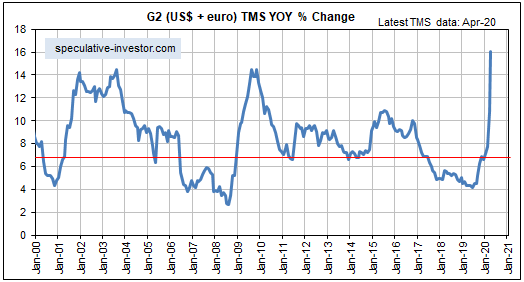
1)
The combination of US and euro-zone money supply that we call G2 True
Money Supply (TMS) was at a 10-year low in the middle of last year. It is
now at an all-time high. This is by far the most bullish force currently
acting on equity and commodity prices.
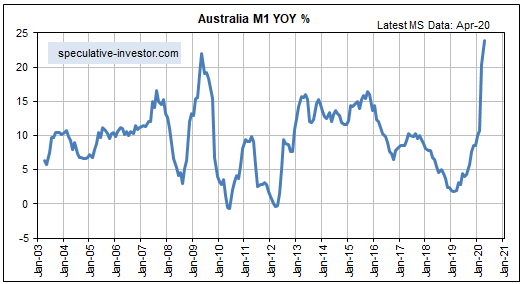
2) Early last year Australia was in danger of experiencing monetary
deflation, but this country's monetary inflation rate has since rocketed
to an all-time high of 24%. This is not bearish for the A$ relative to
other currencies and especially not relative to the US$ (we suspect that
the A$ will trade at parity with the US$ within two years), because the
A$'s exchange rate is influenced to a far greater extent by the commodity
markets than by the local monetary inflation rate. However, it suggests
that in Australia the prices of goods, services and assets will go up a
lot over the next few years.
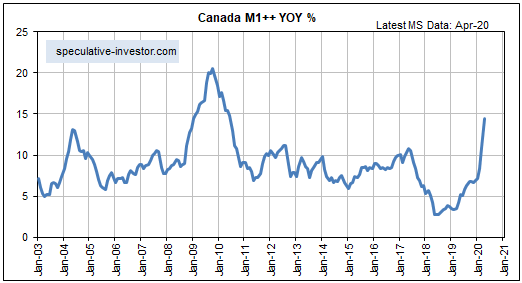
3) The Bank of Canada has been a little more circumspect than most
other central banks over the past few months, but in response to the
recent crisis it has done enough to boost the country's monetary inflation
rate to near a 10-year high. A year ago it was near a 20-year low.
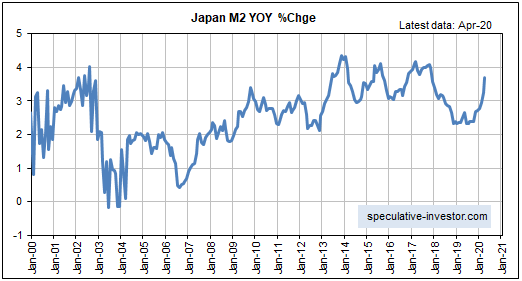
4) We occasionally read articles that attempt to make the case that
central bank money pumping does not lead to higher prices, with the
situation in Japan cited as evidence. Japan supposedly is relevant because
the Bank of Japan (BOJ) has been aggressively monetising assets for a long
time with minimal effect on prices.
As we've noted many times in
the past, prices have been stable in Japan because Japan's monetary
inflation rate has oscillated at a relatively low level for decades.
Whatever the BOJ has been doing, it has NOT been pumping money at a rapid
rate. Even now, in the face of additional monetary stimulus, the
year-over-year rate of growth in Japan's M2 money supply is below 4%. This
contrasts with a US money-supply growth rate of almost 20%.
Therefore, the low rate of price inflation in Japan is in no way
mysterious. It's exactly what would be expected from an economy with a low
rate of monetary inflation and some productivity growth.
In summary, outside of Japan the supply of currency is increasing at
such a fast pace that there WILL be substantial price increases over the
next two years. However, the price increases won't be uniform. For
example, due to a high unemployment rate the price of labour probably will
be a laggard, and due to their relative supply situations the price of oil
probably won't rise by as much as the prices of uranium, natural gas,
copper, nickel and zinc.
The shortest US
recession ever?
Due to the lockdowns, earlier
this year some US economic performance indicators plunged from fairly
normal levels to near their worst levels in history within the space of
only a month. Because this unprecedented economic collapse was followed in
quick time by a huge increase in spending by the government and a flood of
new money/credit courtesy of the Fed, later this year it probably will
seem like the entire recession lasted only 4-6 months. This would make the
2020 recession the shortest ever.
However, the rebounds in economic
statistics from whatever lows are put in place during the second quarter
of 2020 probably will end with the economy at only about 80% of what it
was at the start of this year, because creating huge amounts of money and
credit out of nothing and paying people NOT to work cannot make up for the
real wealth destruction, including the permanent loss of millions of small
businesses, caused by the economic lockdowns of March-June 2020. On the
contrary, the falsification of price signals by the Fed and the
channelling of savings from the private sector to the government will do
additional structural damage to an economy that already was weak prior to
the virus-related lockdowns.
Therefore, while the National Bureau
of Economic Research (NBER), the official arbiter of US recessions, could
end up determining that the 2020 recession was over by July or August,
there will be such a large amount of 'rot' in the economic foundations
that by 2022 there probably will be another recession.
Based on
what's likely to happen with official economic statistics and NBER
assessments, we think that the 2020-2022 performance of the US economy
will end up looking like the picture displayed below. This picture shows
two recessions separated by a period of growth that probably won't feel
like growth to the majority of people. We envisage the bulk of the
economic rebound being complete by the end of this year, with potentially
a little more strength during the first half of next year in response to
enthusiasm about a multi-trillion-dollar infrastructure spending bill.
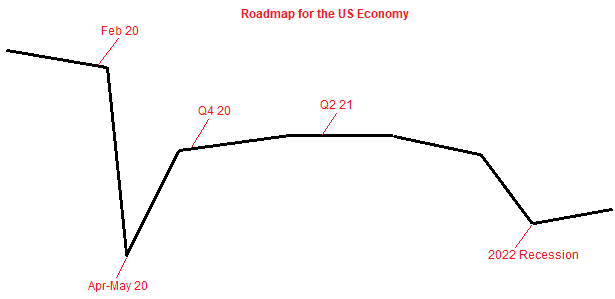
A final point is that regardless of how short the 2020 recession
officially turns out to be, in one important respect it will be the worst
recession in history. We are referring to the fact that due to the
government-enforced shutting down of large sections of the economy, for
the first time ever business failure will have little to do with long-term
business viability. Instead, failure will be indiscriminate. Some
poorly-run businesses will survive because the government deemed them to
be "essential", whereas many well-run businesses will 'go under' because
the government deemed them to be "non-essential".
The Stock Market
Sentiment is still 'mixed'. Some
sentiment indicators suggest that the FOMO (fear of missing out) is
palpable. For example, the 10-day MA of the equity put/call ratio has
dropped to where it was at the February-2020 all-time S&P500 Index (SPX)
high. At the same time, however, there is evidence that the public remains
worried about downside risk. For example, the COT data show that last week
the small traders (the proverbial dumb money) had close to their
largest-ever collective net-short position in SPX futures.
In any
case, sentiment is just one piece of a large puzzle. It should be taken
into account, but no market ever commenced a downward trend simply because
traders became very bullish and no market ever commenced an upward trend
simply because traders became very bearish.
The ideal situation is
for sentiment, fundamentals and price action to line up behind one
particular outcome, but that doesn't happen often and is not the case in
any of the major financial markets right now. In the stock market, for
instance, we currently have bearish fundamentals, mixed sentiment and
price action that is bullish but dangerously stretched. The fundamentals
always win in the end, but markets can trend counter to the fundamentals
for inconveniently long periods.
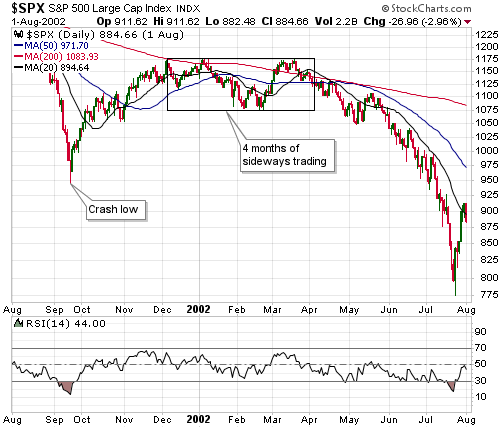
With regard to the performance of
the S&P500 Index (SPX) over the next few months, recently we've had two
scenarios in mind. The more likely scenario involved the SPX oscillating
within about a 10% horizontal range, with the upper boundary of the range
coinciding with the 200-day MA +/- a few percent. This would be similar to
what happened following the rebound from the September-2001 crash, as
illustrated by the following chart. We previously included this chart in
the 18th May Weekly Update.
The less likely, albeit still plausible, scenario involved the SPX
soon commencing a downward trend that would lead to a test of the
March-2020 low. This would be similar to what happened following the
rebound from the November-2008 crash low.
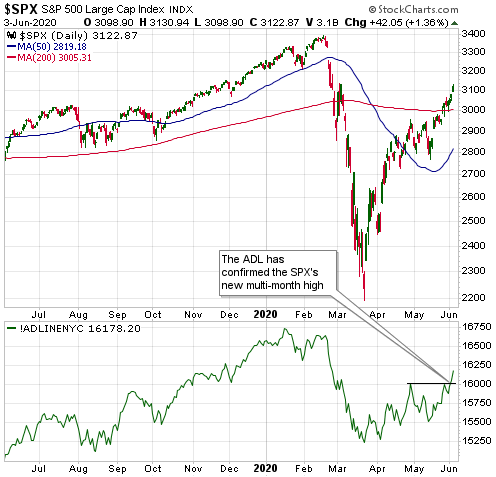
On Tuesday of this week
the new multi-month highs achieved by the SPX over the preceding 2-3 weeks
were confirmed by the NYSE Advance-Decline Line (ADL), removing a bearish
divergence. Refer to the following daily chart for the details. This
shifts the odds further in favour of the first scenario. This scenario
could involve a correction that retraces as much as half the gain achieved
in the rally from the March low, although a smaller correction is more
likely.
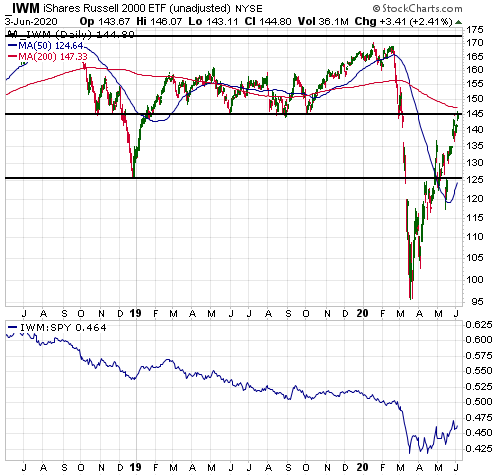
The next chart shows that the Russell2000 ETF (IWM) has moved back up
to resistance at US$145. This is a reasonable place to add a new or
average down on an existing IWM put option position, but don't be
aggressive. The US stock market's short-term risk/reward is bearish, so it
certainly makes sense to own some insurance. However, with regard to the
next few months there is a much better chance of a normal correction than
a dramatic plunge.
We continue to like the idea of being long the depressed
commodity-related equities (e.g. O&G stocks/ETFs) that still have
substantial rebound potential while being hedged via cash and put options.
Gold and the Dollar
Gold
In
the Stock Market section of today's report, we wrote: "The ideal
situation is for sentiment, fundamentals and price action to line up
behind one particular outcome, but that's not the case in any of the major
financial markets right now." In the gold market, over the past
several weeks we've had bullish fundamentals, sentiment that implied
significant short-term downside risk and noncommittal price action. That's
still the case, although the price action will turn bearish if support at
$1690 is taken out.
The following daily chart shows that support at
$1690 was tested again on Wednesday 3rd June and again it held. When a
support level is tested as many times as this one has been tested, more
often than not it will end up being breached.
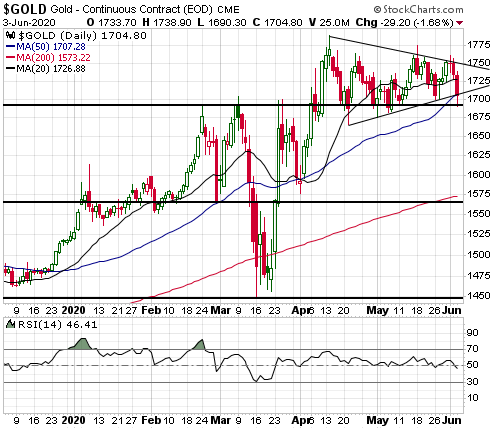
If support at $1690 is taken out then the stage will be set for the
US$ gold price to drop back to the $1560-$1600 range. We think that this
is the most likely short-term outcome. We also think that it would be
positive, because it would create a new low-risk buying opportunity (more
so in the mining shares and silver than in gold bullion). However, it's
also possible that the 'choppy' sideways trading of the past seven weeks
constitutes a nearly-complete correction and that a $100+ move to the
upside will soon begin. From our perspective this would be less positive,
because it would sidestep a low-risk buying opportunity and leave a
moderately high-risk sentiment situation in place.
Gold
Stocks
Last week the HUI broke below support in the 280s
and its 20-day MA. Early this week it rebounded to its 20-day MA and then
reversed course. This price action validates last week's break below
support, but the more important support at 260 is yet to be breached.
Breaching this support would suggest that the HUI was on its way to the
220s, which continues to be our target for a correction low.
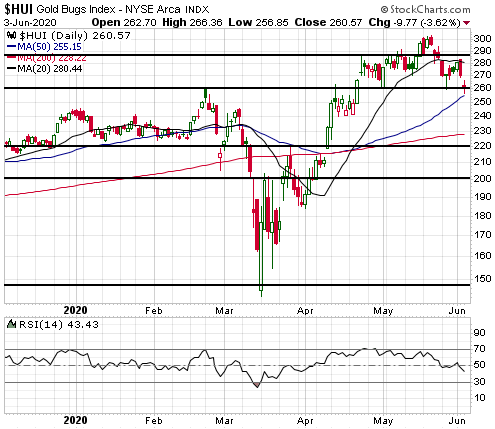
In our own account and in the TSI List there are some June-2020 GDX
put options that are too far out of the money to be useful hedges at this
time. We want to be hedged and so on Monday of this week we attempted to
buy some GDX September-2020 put options that are much closer to the money,
but the order wasn't filled (the option price didn't quite make it to our
bid level). Therefore, we find ourselves in the position of having no
insurance apart from a sizable cash reserve. This isn't ideal, but it
isn't a major concern because a) the gold mining sector probably won't
experience anything more bearish in the short-term than a routine
correction (a decline by the HUI to around 220 would mean that about half
the gain from the March low had been retraced, which would be perfectly
normal) and b) the intermediate-term risk/reward remains bullish.
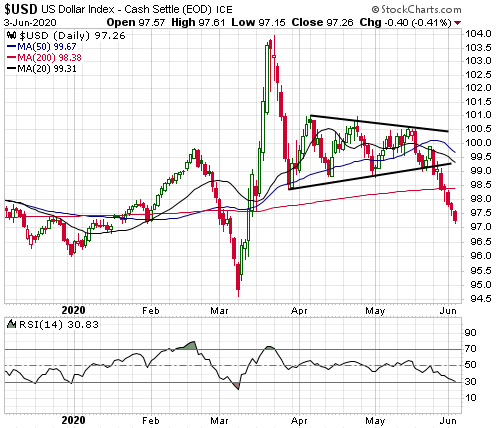
The Currency Market
Last week the Dollar Index
(DX) broke out to the downside from its short-term range, and over the
first three days of this week it extended its decline.
We were
expecting at least a 2-point move in the direction of the breakout. This
minimum expectation already has been met, and based on the daily RSI shown
at the bottom of the following chart the DX's decline is a little
stretched on a short-term basis. This warns that a countertrend US$
rebound may begin within the next few days.
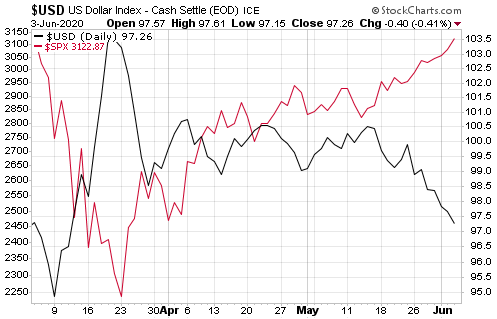
A potential catalyst for a countertrend rebound in the DX is suggested
by the next chart, which shows that there has been a strong inverse
relationship between the DX and the US stock market over the past three
months. The chart implies that the DX will rebound in parallel with the
next stock market correction.
Updates on Stock Selections
Notes: 1) To review the complete list of current TSI stock selections, logon at
http://www.speculative-investor.com/new/market_logon.asp
and then click on "Stock Selections" in the menu. When at the Stock
Selections page, click on a stock's symbol to bring-up an archive of
our comments on the stock in question. 2) The Small Stock Watch List is
located at http://www.speculative-investor.com/new/smallstockwatch.html
![]() Deutsche
Bank (DB) Options
Deutsche
Bank (DB) Options
In November-December of last year we
added a DB January-2021 call option and a DB January-2021 put option to
the TSI List in anticipation of a big move in the underlying stock in one
direction or the other during 2020. As it turned out, there already have
been three big moves in the stock and 2020 is not even half over.
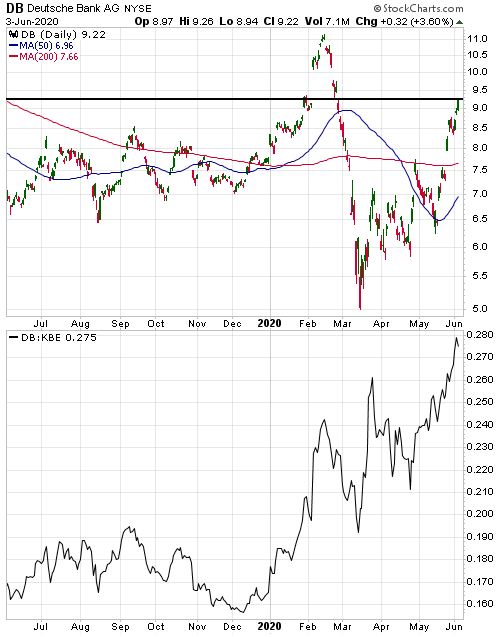
We removed the DB put option during the March crash for a gain of
163%, and with the stock having risen sharply to resistance we are now
going to exit the DB trade altogether by removing the call option. Based
on the closing price of US$1.14 on Wednesday 3rd June and last November's
entry at US$0.55, the result was a gain of 107%.
The average profit
across the two DB options was 135%.
Chart Sources
Charts appearing in today's commentary
are courtesy of:
https://stockcharts.com/
![]()