![]()
![]()
![]()
![]()
- Interim Update 3rd October 2018
Copyright
Reminder
The commentaries that appear at TSI
may not be distributed, in full or in part, without our written permission.
In particular, please note that the posting of extracts from TSI commentaries
at other web sites or providing links to TSI commentaries at other web
sites (for example, at discussion boards) without our written permission
is prohibited.
We reserve the right to immediately
terminate the subscription of any TSI subscriber who distributes the TSI
commentaries without our written permission.
The September Monthly
(and Quarterly) Close
The closing prices for September
provided a small amount of additional information, although on a monthly
closing basis the currency market continues to do what it needs to do to
maximise uncertainty.
The US$ gold price has now declined for 6
months in a row and has just achieved its fourth consecutive monthly close
below its 21-month MA (the blue line on the following chart). Moreover,
the 8-month MA (the black line on the following chart) has just crossed
from above to below the 21-month MA. This is long-term bearish, but it
doesn't preclude a tradable multi-month rebound.
(Note that the
following monthly charts show the situation at the end of September, that
is, the charts don't include the first few trading days of October.)
As was the case at the end of the preceding month, the September close
for the Dollar Index (DX) was noncommittal. The DX was virtually unchanged
over the course of the month and ended September marginally below critical
resistance. This means that the monthly close provided no help in
determining whether the rebound from the early-2018 low was a
counter-trend move in a new US$ bear market or the resumption of the US$
bull market that began in 2011.
The euro is in a similar position to the DX, except that whereas the
DX is challenging critical resistance the euro is challenging critical
support.
The following monthly chart shows that the euro tested
support at 115.6 during each of the past 5 months. The support has been
violated multiple times on an intra-month basis (most recently this week),
but it has held firm on a monthly closing basis despite a fundamental
backdrop that has strongly favoured the US$ over the euro.
A
monthly euro close below 115.6 would be evidence that the euro's reversal
from its Q1-2018 high marked the resumption of its multi-year bearish
trend as opposed to the start of a corrective pullback within a new
multi-year bullish trend.
Our final monthly chart is consistent with the view that a
long-term top is in place for the 30-year T-Bond. It shows a downside
breakout in January to complete a major head-and-shoulders topping pattern
and then eight consecutive monthly closes below the 84-month MA (the blue
line).
The bond market
is pushing the envelope
The market for long-dated US
Treasury securities is threatening to break out to the downside. In fact,
by some measures it has already broken out. If a downside breakout is
confirmed by the weekly close on 5th October it will be consistent with
our big picture view that a bond bear market began in July-2016, but it
will be inconsistent with our expectation for a multi-month counter-trend
rally to precede a downside breakout to new lows for the year.
For
the iShares 20+ Year Treasury Bond ETF (TLT), the breakdown level is
$116.00. This level is defined by the lows of the past three years and was
breached on a daily closing basis on Wednesday 3rd October.
For the 10-year T-Note, the breakdown level is defined by the May-2018
low near $118.
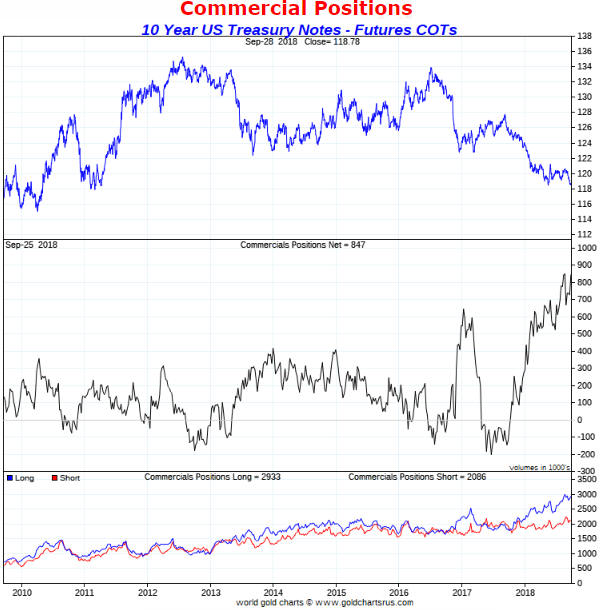
The reason we've been expecting a counter-trend rally prior to a
downside breakout is the extremely-lopsided sentiment situation indicated
by the COT data.
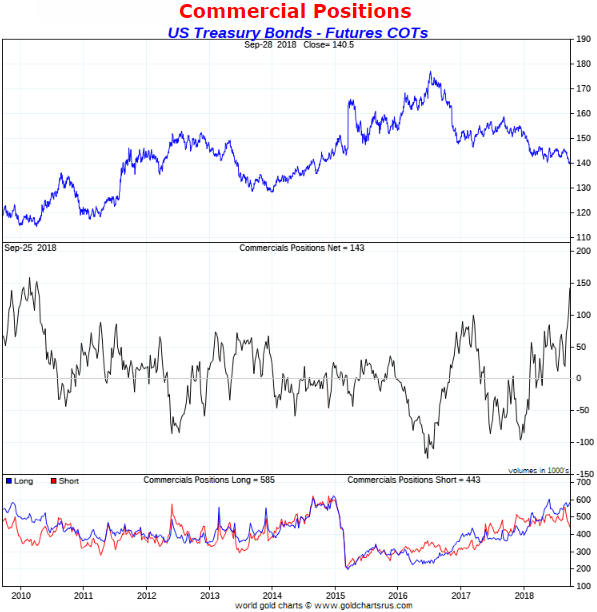
According to the following charts, the sentiment
situation became even more lopsided last week. The middle section of the
first chart shows that the commercial net-long position (the equivalent of
the total speculative net-short position) in 10-year T-Note futures
returned to its August-2018 all-time high last week, while the middle
section of the second chart shows that the commercial net-long position in
30-year T-Bond futures has just risen to its highest level since 2010.
The T-Bond and gold markets are in similar positions in that they are
both being supported by bullish sentiment and weighed down by bearish
fundamentals.
Due to the sentiment situation we expect that a
near-term downside breakout in the bond market will not have much
follow-through, at least in terms of time.
The O&G Rally
When the oil price broke above
short-term resistance at around $70.50 during the week before last it
suggested that the July high would be tested or marginally exceeded prior
to the start of a meaningful correction. On Wednesday 3rd October the July
high was marginally exceeded. The rise in the oil price to a new high for
the year could turn out to be an important upside breakout, but the
breakout must be confirmed by the weekly close to make it official.
Also worth mentioning is that there was significant strength and a
minor upside breakout in the natural gas price within the past few days.
The strength in the oil market, the strength in the stock market and
the weakness in the T-bond market appear to be linked. Moreover, each of
these markets looks stretched in the direction of its current short-term
trend, so reversals could happen at any time.
We will have more to
say about oil and gas in the coming Weekly Update.
The Stock Market
The US Bank Index (BKX) has been
very weak over the past month, both in nominal dollar terms and relative
to the broad market as represented by the SPX. This weakness is surprising
given that US bank stocks generally have reasonable valuations and the
fundamental backdrop appears to be bullish for banks. However, the global
banking system is interconnected, so it's likely that US bank stocks are
being pulled down by the problems and obvious risks in the euro-zone
banking industry.
With reference to the following daily chart, the
BKX has important support at $103-$104. This support has been tested
numerous times over the past 7 months, with the most recent test occurring
on Tuesday of this week.
A weekly close below $103 would be a
decisive breakdown.
According to the article posted
HERE, there have been 10 "Hindenburg Omen" signals over the past month
or so. A cluster of such signals appears to be a necessary, but not a
sufficient, condition for a substantial stock market decline.
The
large number of Hindenburg Omens in the recent past appears to be related
to the adverse effect of rising interest rates on the fixed-income
securities that trade on the stock market. The same phenomenon is
impacting measures of stock-market breadth. For example, the all-stocks
NYSE Advance-Decline Line (ADL) shown in the bottom section of the
following chart suggests that there has been a bearish divergence between
the ADL and the SPX since late-August, but an ADL that includes only
common stocks does not reflect the same bearish divergence.
Another concern is that on 26th September our put/call indicator
generated its first sell signal in almost two years. A sell signal occurs
when the ratio shown in the bottom section of the following chart drops
below 0.30.
Historically, put/call sell signals have been less
reliable than put/call buy signals. However, they usually work if they
occur when the market is short-term 'overbought', as is the case right
now.
The relative weakness of the banking sector, the Hindenburg Omens and
the put/call sell signal are warnings that a meaningful (5%-10%) decline
could soon get underway, but the developing downside breakout in the bond
market is by far the biggest threat to the stock market. If the bond
market extends its recent decline then the stock market will be in
trouble.
A daily SPX close below 2870 would be evidence that a
meaningful stock market decline had begun.
Gold and the Dollar
Gold
Our
Gold True Fundamentals Model (GTFM) is the best indicator of the extent to
which the fundamental backdrop is bullish or bearish for gold. A less
accurate, but simpler -- and still effective most of the time -- way to
assess gold's fundamental situation is to monitor the bond/dollar ratio
(the T-Bond price divided by the Dollar Index). Below is a weekly chart
comparing the US$ gold price with the bond/dollar ratio.
The
bond/dollar ratio is now testing its low of the past 5 years, so an
argument could be made that the US$ gold price is higher than it should
be.
A substantial gold rally cannot occur in the face of a gold-bearish
fundamental backdrop, but both the sentiment situation and the price
action suggest the potential for a significant extension of the recent
rebound.
With regard to gold's price action in US$ terms, the
50-day MA has acted as a ceiling on numerous occasions over the past three
weeks. This suggests to us that a lot of 'buy stops' will be triggered if
the US$ gold price manages to close above this MA.
Silver
The silver price lagged the gold price
as part of the bottoming action of the past two months. This is normal and
actually could be viewed as a positive sign.
Late last week the
silver price made a catch-up move and is now in a similar position to the
gold price. Like the gold price, the silver price is challenging
short-term resistance defined by its 50-day MA.
Even if we are dealing with nothing more than a counter-trend rebound,
which will be the case unless the fundamental backdrop turns in gold's
(and therefore silver's) favour, the silver price could rise as high as
$16 within the coming 6 weeks.
Gold Stocks
The good news is that the gold-mining sector, represented on the following
chart by the Gold Miners ETF (GDX), appears to be basing. This suggests
that additional gains will be made over the weeks ahead. The bad news is
that the rebound from the early-September low looks more like a
counter-trend move than an important reversal. The reason is that it has
taken 16 trading days for GDX to reach its 50-day MA, whereas the initial
up-moves following intermediate-term bottoms tend to reach/exceed the
50-day MA in 7 days or less.
If we are dealing with a short-term
rebound within an on-going intermediate-term downward trend, then GDX's
upside probably will be limited by resistance near $21.00. For the HUI,
the equivalent resistance lies at around 170.
As we first mentioned a couple of months ago, the way things are
panning out the November-December period, which has provided a tradable
low for the gold-mining sector in each of the past 5 years, could provide
a tradable high (a high that should be used for hedging or selling) in
2018. We'll see.
The Currency Market
The
much higher-than-expected budget deficit projected by Italy's government
caused a sell-off in Italian government bonds and increased the demand for
German government bonds. The additional fear-related demand for German
government bonds widened the US-Germany yield spread to a new multi-year
high in the dollar's favour, putting irresistible downward pressure on the
euro and upward pressure on the Dollar Index (DX) over the past 5 trading
days.
On Wednesday 3rd October the euro broke below lateral support
at 115.6. This suggests that the August low will be tested within the next
few weeks.
Updates on Stock Selections
Notes: 1) To review the complete list of current TSI stock selections, logon at
http://www.speculative-investor.com/new/market_logon.asp
and then click on "Stock Selections" in the menu. When at the Stock
Selections page, click on a stock's symbol to bring-up an archive of
our comments on the stock in question. 2) The Small Stock Watch List is
located at http://www.speculative-investor.com/new/smallstockwatch.html
![]() Company
news/developments for the week ending Friday 28th September 2018:
Company
news/developments for the week ending Friday 28th September 2018:
[Note: AISC = All-In Sustaining Cost, FS = Feasibility Study, FY =
Financial Year, IRR = Internal Rate of Return, ISR = In-Situ Recovery,
MD&A = Management Discussion and Analysis, M&I = Measured and Indicated,
NAV = Net Asset Value, NPV(X%) = Net Present Value using a discount rate
of X%, NSR = Net Smelter Return, P&P = Proven and Probable, PEA =
Preliminary Economic Assessment, PFS = Pre-Feasibility Study]
*Alkane Resources (ALK.AX) is going ahead with the
development of underground mining operations at its Tomingley gold mine.
The plan is for the new underground operation to produce 93,000 ounces of
gold over a 40 month period commencing mid-2019.
Due to the high
forecast cash costs of the underground operation (A$1,100-$1200/oz), the
aforementioned 93K ounces of production won't add much cash to ALK's
balance sheet. In fact, developing the underground operation initially
will drain A$25M from ALK's cash reserve (A$80M at 30th June). However,
the underground operation will create opportunities to discover new
economic gold resources and thus extend the overall mine life.
*Blackham Resources (BLK.AX) has raised A$7.5M by issuing
a secured convertible note with a 24-month term to The Lind Partners, a
New York based institutional fund manager and a long-time investor in BLK.
This financing, along with BLK's existing cash, will be used to fully
repay A$13M of short-term secured debt owed to Orion.
The note will
be convertible into BLK shares at the lower of A$0.08 and 90% of a
volume-weighted average market price. Also, the first repayment is
scheduled for 14th February 2019, which is two weeks after the expiry date
of 534M A$0.08 options. The idea is that any proceeds received from
exercising the options will be used to repay the convertible note.
Issuing the convertible note to Lind could turn out to be a high-cost or a
reasonable-cost financing arrangement for BLK depending on whether its
stock price is above A$0.08 early next year. If it is above $0.08 then a
lot of cash will flow into the company due to the exercising of the
above-mentioned options and the note will be repaid at a reasonable cost,
but if the stock price is still well below A$0.08 when the options expire
in January then the cost of repaying the note will be high.
*Clean TeQ (CLQ.AX, CLQ.TO) has formed a JV with Ionic
Industries Pty Ltd to develop and commercialise a graphene-oxide based
water filtration membrane (GO-Membrane). CLQ will own 75% of the JV. The
goal is for the GO-Membrane to replace the existing membranes in reverse
osmosis and nanofiltration systems used for water purification (e.g.
converting seawater into drinkable fresh water). According to CLQ's press
release, the GO-Membrane manufacturing process has already been
demonstrated on commercial scale industrial equipment.
The
GO-Membrane JV is financially irrelevant to CLQ at this time, but it's an
interesting opportunity that could have significant value in the future.
Chart Sources
Charts appearing in today's commentary
are courtesy of:
https://stockcharts.com/
http://www.goldchartsrus.com/
![]()