|
- Interim Update 3rd November 2010
Copyright
Reminder
The commentaries that appear at TSI
may not be distributed, in full or in part, without our written permission.
In particular, please note that the posting of extracts from TSI commentaries
at other web sites or providing links to TSI commentaries at other web
sites (for example, at discussion boards) without our written permission
is prohibited.
We reserve the right to immediately
terminate the subscription of any TSI subscriber who distributes the TSI
commentaries without our written permission.
More Inflation
According
to the Fed, the US economy is too weak and the rate of "price
inflation" is too slow. Also according to the Fed, the solution to
these problems is to buy more treasury securities using newly created
money. While we can certainly understand how creating more money out of
nothing to buy government debt will eventually lead to more "price
inflation", we fail to see, and Fed Chairman Bernanke has failed to
explain, the logic behind the idea that the rate of economic progress
can be improved by counterfeiting money. It seems that logic is in a
locked room inside Bernanke's brain, and he has thrown away the key.
In the statement
issued at the conclusion of this week's FOMC meeting, the Fed managed
to go just far enough to meet the "quantitative easing" expectations of
the markets. The $600B magnitude of the new program ($75B per month for
8 months) was probably a little below the average expectation, but the
Fed left itself some 'wiggle room' -- that is, the ability to increase
the amount of money-printing at a later date -- by stating that it
would "adjust the program as needed".
Due to the lower-than-expected magnitude of the new QE program, markets
that had risen over the past two months initially sold off in the wake
of the Fed's announcement. However, most markets quickly recouped their
losses when it was realised that the Fed had left the door open to more
monetary inflation if the current plan didn't have the desired effect
on prices.
Note that how the Fed goes about its QE-related T-Bond purchases will
potentially alter the short-term effects of these purchases. For
example, if the Fed buys T-Bonds directly from the government or from
non-bank sellers then the bond purchases should immediately add to the
economy's total money supply, but if the Fed buys from banks it could
increase bank reserves without immediately affecting the economy's
total money supply (bank reserves aren't included in the money supply).
As far as we know, the specific details of how the new QE program will
be implemented have not yet been publicised.
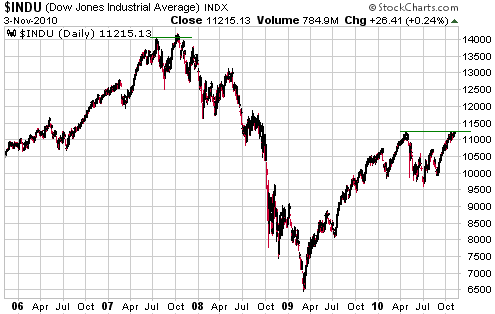
The Stock Market
This
week's two big news events (the US mid-term elections and the Fed's
announcement) had the potential to cause a lot of volatility in market
prices, but in the end very little actually happened in the markets.
The Dow Industrials Index, for example, achieved minor gains on each of
the first three days of this week, for a total week-to-date gain of
about 1%.
At the end of Wednesday's session the Dow was positioned at resistance
defined by its April high. This is a logical place for some sort of
corrective move to begin, but a pullback at this time would probably be
followed by a rise to a new 52-week high alter in the month. Which
prompts the question: What would a break by the Dow to a new 52-week
high tell us about the future?
In our opinion: nothing. The NASDAQ100 Index (NDX), an arguably more
important index than the Dow, has already broken decisively above its
April high, so if the Dow soon breaks out to the upside it will only be
following in the NDX's footsteps. Also, breaks above resistance that
happen after a market has been trending upward for a long time are not
reliably bullish. The Dow's performance in 2007 provides us with a
classic example, in that the break to a new high for the year (and a
new all-time high) in early October of that year occurred a few days
prior to the start of one of the worst declines in stock market history.
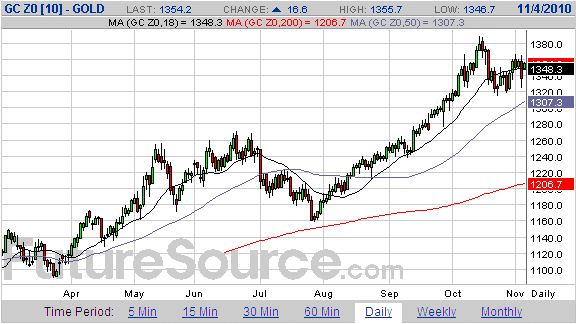
Gold and
the Dollar
Gold
Gold sold off ahead of the Fed's announcement on Wednesday and fell
further in the immediate aftermath of the announcement, as some gold
'longs' were no doubt disappointed that the Fed's QE plans weren't
bigger and bolder. This created an opportunity to buy as low as the
mid-$1320s. The phrase "adjust the program as needed" subsequently
registered with market participants and the gold price rebounded.
The end result of the fluctuations is that gold is now in a similar
position to where it was at the end of last week. A quick decline to
the 50-day moving average or lateral support at $1260-$1270 remains a
realistic possibility, but the downside risk doesn't look worrisome
relative to the upside potential.
Gold Stocks
As is the case with gold, the reactions to this week's news events
didn't significantly alter the positions of the gold-stock indices. The
HUI, for example, is thus far almost unchanged over the course of the
week. This means that there are still two plausible near-term
possibilities, one being that a minor correction ended last week and
the other being that the rebound from last week's low has formed the
'B' leg of an on-going A-B-C correction. In the latter scenario, the
'C' leg could bottom anywhere from 480 down to the 450s.
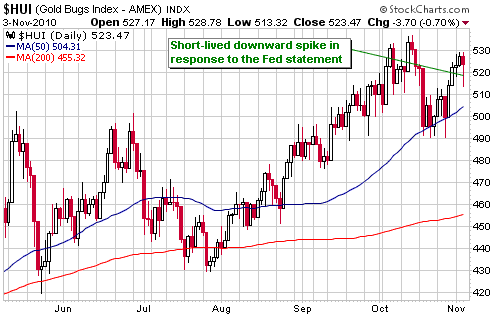
We have now entered a
4-week time window (early November through to the first two trading
days of December) when important gold-sector turning points regularly
occurred over the past decade. If there is going to be an important
turning point within the same timeframe this year then it will have to
be a turn from up to down, but in order for that to become possible the
HUI must first make a new high.
Currency Market Update
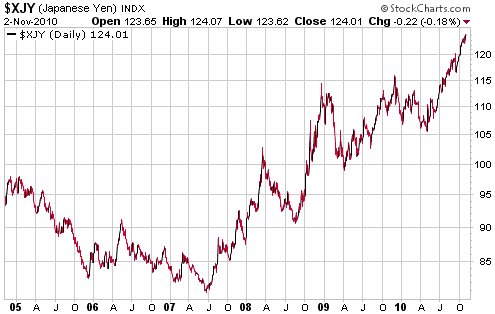
The Yen
Long-term trends in currency exchange rates have little to do with
relative rates of economic growth and a lot to do with relative
monetary inflation rates. This explains why the Yen has generally been
a strong currency during Japan's 20-year period of economic stagnation
(the rate of increase in Yen supply has averaged a relatively slow
2%/year throughout this period). On an intermediate-term basis,
however, it is not uncommon for long-term differences in monetary
inflation rates to be overridden by other influences. For example, the
extremely low interest rates implemented by the Bank of Japan caused
the Yen carry trade to become internationally popular and led to
relentless Yen weakness during 1995-1998, 2000-2001 and 2005-2007. But
because the underlying Yen inflation rate generally stayed at a
relatively low level, the Yen always bounced back vigorously whenever
something happened to diminish the carry-trade's popularity. The
"something" tended to be a decline in global growth or growth
expectations.
During the third quarter of 2007, market participants began to worry
about the possibility of a global economic slowdown. Consequently, the
popularity of the Yen carry trade began to shrink and the Yen reversed
course -- from downward to upward -- against all major currencies. The
Yen's rise then accelerated between August and December of 2008 as
moderate fears of slower growth transformed into outright panic.
After the 2008 panic, the Yen's performance relative to the US$
deviated from the well-worn pattern. In particular, the Yen essentially
moved sideways during the financial-market and economic rebounds of
April-2009 through to April-2010, and then resumed the upward trend
that began in the third quarter of 2007. Most significantly, over the
past four months there has been a relentless rise in Yen/USD despite
the coincident strong rises in equity and commodity markets. Based on
the pattern of the past several years we would have expected such a
strong rise in the Yen to be associated with downward, not upward,
moves in equities and commodities.
A plausible
explanation for the above-mentioned change in Yen/USD's performance is
that with US$ interest rates having been forced down to the vicinity of
Yen interest rates there is no longer anything to be gained by
borrowing the Yen to buy the US$. This leaves Yen/USD at the mercy of
its dominant long-term fundamental driver (the difference in monetary
inflation rates between the US and Japan), which is clearly Yen-bullish
at this time.
The big question is: for how long will relative inflation rates support the Yen's upward trend against the US$?
No one knows the answer, but we suspect that the Yen won't remain a
low-inflation currency for much longer. The Japanese Government is
hugely indebted and will be taking on a lot more debt in the future,
but the Japanese public's willingness to accumulate the debt of its
government has probably been exhausted. In fact, there's a good chance
that Japan's aging population will be net sellers of Japanese
Government Bonds over the years ahead. This means that in the
not-too-distant future Japan's government will find itself in the
position of having to 1) directly default on its debt, 2) indirectly
default on its debt via inflation, or 3) let interest rates rise to
levels that are high enough to attract foreign investors. The first
option would be best for the long-term health of Japan's economy, but
it would not be politically feasible given that the voting public owns
most of the debt. Considering that the existing debt burden is 200% of
GDP, the third option would not be financially viable because it would
lead to impossibly-high interest payments. At least, option 3) would
only be financially viable if combined with option 2). In other words,
the Japanese government's long experiment with Keynesian economics has
left it in the position where resorting to the large-scale creation of
new money will soon become the only viable option.
Via monetary inflation, a government can make the voters pay without directly charging them.
Current Market Situation
The Yen-USD relationship has changed over the past year or so, probably
as a result of US interest rates having shrunk to 'Japanesque' levels.
However, the relationship between the Yen and the Australian Dollar has
not changed. As evidenced by the following chart, the A$/Yen exchange
rate continues to move in synch with Hong Kong's Hang Seng Index (a
proxy for global growth expectations).
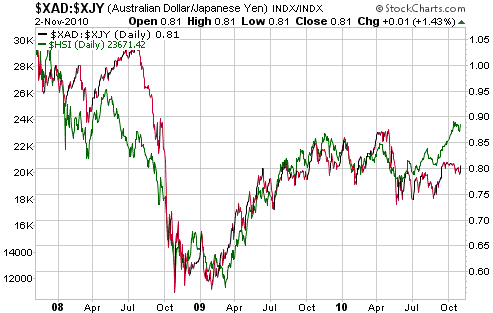
The fact that the
A$-Yen relationship continues to work as it has for many years can be
explained by the A$'s relatively high interest rates. In other words,
when global growth expectations are on the rise it still makes sense,
from the perspectives of many investors/speculators, to borrow in terms
of the Yen and lend/invest in terms of the A$, and to retreat from
bullish-A$/bearish-Yen positions when it looks like global growth may
be about to decline.
There will likely be a large fall in the value of the A$ relative to
the values of both the Yen and the US$ after the global stock market
rally ends, but not before.
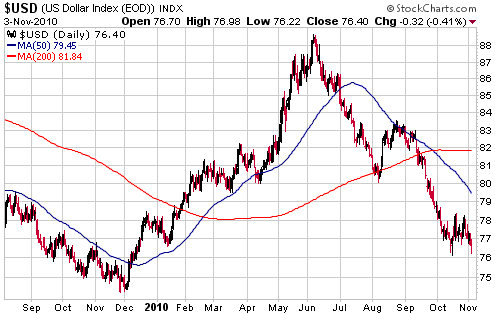
The following daily chart shows that the Dollar Index tested its
October low on Wednesday 3rd November. This test could turn out to be
successful, in which case a multi-week rebound is about to begin.
Alternatively, short-term support could give way, resulting in a drop
to intermediate-term support at 74.5-75.0. Either way, the remaining
short-term downside risk appears to be relatively minor. However, the
short-term upside potential also appears to be relatively minor,
especially with equities and commodities still in rally mode.
Update
on Stock Selections
(Notes: 1) To review the complete list of current TSI stock selections, logon at http://www.speculative-investor.com/new/market_logon.asp
and then click on "Stock Selections" in the menu. When at the Stock
Selections page, click on a stock's symbol to bring-up an archive of
our comments on the stock in question. 2) The Small Stock Watch List is
located at http://www.speculative-investor.com/new/smallstockwatch.html)
 New stock selection: Duoyuan Global Water (NYSE: DGW). Shares: 25M (American Depository Shares). Recent price: US$12.49 New stock selection: Duoyuan Global Water (NYSE: DGW). Shares: 25M (American Depository Shares). Recent price: US$12.49
We review the stock picks of other
newsletters and read articles at various web sites in the hope of
finding interesting investments/speculations for our own money and new
stock selection ideas for TSI. For example, under the heading "Fracking
Opportunity" in the 20th September Weekly Update we wrote about an
interesting company called GasFrac Energy Services (TSXV: GFS), which
was brought to our attention by Keith Schaeffer's Oil and Gas Investments Bulletin and was trading at around C$5.00 at the time.
Duoyuan Global Water (NYSE: DGW) was brought to our attention by a new entry into the newsletter business called Asia Pacific Dispatch
(APD). The inaugural issue of this newsletter contained a write-up of
DGW, a China-based company that manufactures equipment for waste-water
treatment, water purification and water conservation. APD's write-up
piqued our interest and prompted us to do some follow-up research.
DGW is an interesting company because it is involved in a business that
is poised to benefit from increasingly stringent government regulation
and strong growth in genuine private-sector demand. It is an
interesting speculation because it: a) has a healthy balance sheet (no
debt, US$210M of cash), b) is very profitable, c) has demonstrated
rapid growth in revenue and profit over the past year and looks set to
continue its expansion over the coming 12 months, and d) is cheap based
on standard valuation metrics.
How cheap is it? Well, by annualising the latest quarterly results we
find that at the current stock price of US$12.49 it has an
enterprise-value/sales ratio of 0.6 and a price/earnings ratio of 7.
Now, anyone experienced in the stock market will realise that
fast-growing, profitable companies with strong balance sheets don't
trade at low valuations for no reason, especially at times when the
average stock is over-valued. The reason that DGW is valued so lowly at
this time is 'guilt by association'. To be more clear, Duoyuan Global
Water has a headquarters and chairman in common with Duoyuan Printing
(NYSE: DYP), and Duoyuan Printing is immersed in a financial reporting
scandal. There is no evidence at this stage that DGW has done anything
untoward, but many shareholders thought it best to sell first and ask
questions later. This led to a 50% decline in the stock price within
the space of a few hours during the first half of September. It also
prompted several ambulance-chasing US law firms to crawl out of the
woodwork and launch class-action suits against DGW, even though, as we
said, there is no evidence of any wrongdoing at this time.
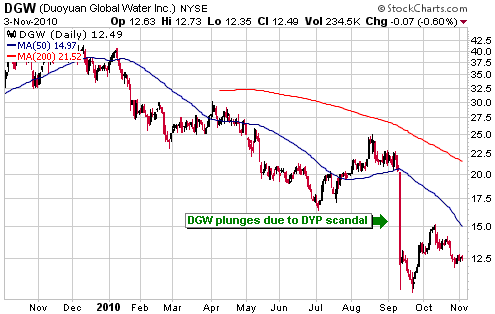
If DGW's financial reports and guidance can be trusted, then at its
current price of around $12.50 the stock offers valuation-related
upside potential of at least 100%. The main risk is that the market is
right and the reports can't be trusted. We think this is a small
risk, but it should be acknowledged.
We are going to add DGW to the TSI Stocks List and will initially
manage downside risk by placing a 'stop', effective on an intra-day
basis, at US$10.50. We will probably remove the protective stop if the
next quarterly financial report, which is scheduled to be issued on
17th November, confirms the attractive valuation and receives the
unqualified endorsement of the company's US auditor.
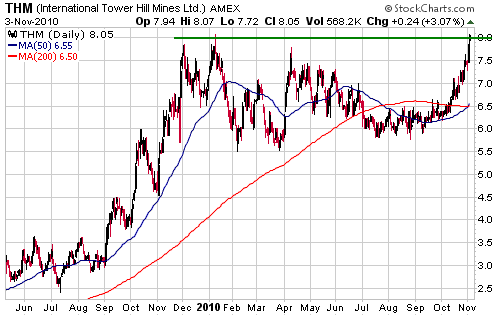
International Tower Hill Mines (AMEX: THM, TSX: ITH). Shares: 85M issued, 90M fully diluted. Recent price: US$8.05
On 13th October, with THM trading at US$6.64, we wrote:
"At current prices THM
has one of the best risk/reward ratios within the realm of
exploration-stage gold mining stocks. In our opinion, it has a lot of
upside potential and relatively low downside risk. It is therefore a
good candidate for new buying for anyone who doesn't yet have a full
position and is looking for greater exposure to the junior end of the
gold-stock universe."
The above paragraph is still applicable, in that THM's current
valuation suggests the potential for a double over the coming 6-12
months. However, with the stock having quickly risen from the US$6.60s
to intermediate-term resistance at $8.00 the probability of a
significant pullback is now greater. In our opinion, THM would have to
drop back to US$7.00-$7.50 to create a new buying opportunity.
Chart Sources
Charts appearing in today's commentary
are courtesy of:
http://stockcharts.com/index.html
http://www.futuresource.com/

|