|
- Interim Update 3rd December 2003
Copyright
Reminder
The commentaries that appear at TSI
may not be distributed, in full or in part, without our written permission.
In particular, please note that the posting of extracts from TSI commentaries
at other web sites or providing links to TSI commentaries at other web
sites (for example, at discussion boards) without our written permission
is prohibited.
We reserve the right to immediately
terminate the subscription of any TSI subscriber who distributes the TSI
commentaries without our written permission.
Copper
Following the run-up in the copper
price to major resistance in the mid-90s our expectation was that December
copper would drop to at least 86 before a correction low would be in place.
A drop to 86 would have simply been a garden-variety bull market correction
and, in fact, we wouldn't have been surprised if the copper price had drifted
all the way back to the low-80s to test the earlier upside breakout. However,
this week's drive to a new 6-year high clearly shows that the correction
ended at around the 88 level. In a bull market most surprises will be on
the upside.
Our preferred way to play the bull
market in copper is via the stocks of junior copper explorers/producers,
and in this regard our favorite stocks are Taseko Mines (TSXV: TKO) and
Adrian Resources (TSX: ADL). Both stocks offer enormous leverage to the
copper price and should be accumulated on weakness. These stocks regularly
make daily moves of 10%-20% so they are not for the faint of heart, but
there's a difference between volatility and risk. The NASDAQ100 Index,
for example, has had extremely low volatility over the past several months
but in our view it is a very risky proposition at the current price. TKO
and ADL, however, have been extremely volatile over this period, but if
the copper price continues along its upward path then the risk of owning
these stocks is not particularly high for anyone with an investment time
horizon of at least 12 months. Of course, individuals can create their
own risk by investing too much money in any one stock.
The US
Stock Market
A potential problem for the markets?
Associated Press, 28th November:
"Four youngsters died of the flu
in Colorado since last week in what U.S. health officials say could foretell
a severe flu season for the country.
The children were 21 months old,
2, 8 and 15, and their deaths startled some health officials because they
happened so close together and so early in the season. Last year, Colorado
had four child deaths during the course of the flu season, which normally
peaks in January and February and runs through April.
Even before the deaths, there were
signs this could be an especially bad flu season. Some parts of the country
-- particularly Colorado, Texas and Nevada -- have been hit hard a month
earlier than usual.
The flu strain doctors are seeing
is the H3N2 Fujian, part of a class of flu viruses that caused severe outbreaks
in the U.S. in the 1990s.
Other flu-stricken children in both
Texas and Colorado are being kept alive on ventilators in hospitals. "Doctors
across the city are saying they've never seen a flu season like this,"
said Ned Calonge, chief medical officer for the Colorado Department of
Public Health in Denver. He said nearly 4,000 cases of flu in adults and
children have been reported in Colorado this fall."
News reports emanating from the US
(see above) and from Europe indicate that the coming Northern Hemisphere
winter could see a particularly severe outbreak of the flu. If these early
signs prove to be indicative of what is to come then there could be important
implications for economic growth and for the financial markets.
The Economy and the Stock Market
Recent economic data in the US have
been very positive. In fact, economic growth throughout the world has generally
been strong over the past few months. This, however, is not something that
should have come as a surprise to TSI readers as our forecast was for a
strong performance by the US economy during the second half of 2003. Furthermore
and as explained in previous commentaries, money-supply growth trends suggest
that it will be the second quarter of 2004 before significant evidence
of economic weakness begins to re-emerge.
An unusually severe flu season could,
though, bring forward the starting point for the next bout of economic
weakness to the first quarter of 2004. This, in fact, could be what is
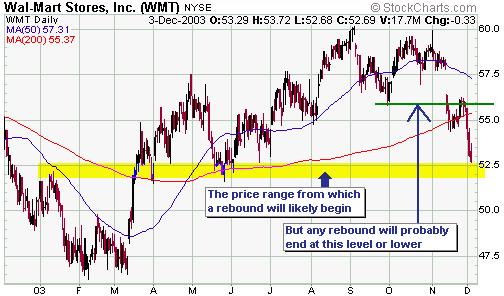
currently being discounted by the stock of the world's largest retailer
(the Walmart stock price has been surprisingly weak of late given the generally
positive equity-market environment).
In recent commentaries we've mentioned
the first half of January as being a likely time for an important stock
market peak. A peak at around this time would be consistent with an economic
slowdown beginning in the second quarter (or possibly as early as the first
quarter if the outbreak of influenza is severe enough) because the stock
market tends to move in advance of the economy (this is why important stock
market peaks tend to occur amidst very positive economic news). A peak
at around this time would also be consistent with the timing of several
of the other major stock market peaks of the past 40 years and meshes with
the bullish complacency that currently permeates the market.
Many financial market commentators
are presently labouring under the belief that the enormous fiscal stimulus
provided by the US Government combined with the enormous monetary stimulus
provided by the Fed will ensure that the equity market and the economy
will remain firm, or at least stable, until after the November 2004 Presidential
election. Our view, however, is that the probability of economic and equity
market strength/stability persisting for more than a few more months is
close to zero. For one thing, the sharp downtrend in the money-supply growth
rate over the past few months indicates that the much-vaunted monetary
stimulus has already lost its effectiveness. And additional aggressive
fiscal stimulus on top of the massive stimulus that has already been provided
would, if it occurred, scare the living daylights out of private-sector
bond investors due to the effect it would have on the already-huge budget
deficit.
In our opinion, the best Mr Bush can
reasonably hope for is that there will be a sharp fall in the stock market
that ends by mid year. If things panned out in this way then the market
could potentially be strong during the few months leading up to the November
election, thus giving the impression that the worst was over.
Anticipating a cycle change
It has been very easy to make money
in the stock market since March of this year. Regardless of whether you
have owned tech stocks, or gold stocks, or financial stocks, or commodity
stocks, or homebuilders, or biotechs, or bank stocks, or cyclical stocks,
or any other kind of stocks, you've probably done well. All you had to
do to make good money was to be long stocks of any type. However, the market
moves in cycles and the cycles typically change in such a way that whatever
worked during the current cycle won't work during the next cycle. On this
basis a characteristic of the next cycle -- one which will probably begin
within the next 3 months given that the current cycle appears to be 'long
in the tooth' -- will most likely be that NO sector of the stock market
will rally. During the next cycle you are probably going to lose a lot
of money regardless of whether you own tech stocks, or gold stocks, or
bank stocks, or commodity stocks, etc.
By the way, we haven't yet seen any
evidence that the above-mentioned cycle change is underway. Therefore,
we don't yet see a need to take any precautions in addition to normal risk
management practices (our normal risk management practices involve, for
example, scaling out of some stocks once they become extended and maintaining
a sizeable cash reserve at all times).
Current Market Situation
The bad news for the bulls over the
first three days of this week includes the breakdown in the Walmart stock
price (see chart below). WMT is probably now close to a short-term bottom,
but the recent price action suggests that its early-September peak will
turn out to be THE recovery high for this stock. With WMT appearing to
have peaked and the S&P500 Index making a new recovery high this week
we therefore have a potentially significant bearish divergence 'on the
go' given WMT's tendency, over the past 18 months, to lead the S&P500
Index at important turning points.
Also in the 'bad news for the bulls'
department is the fact that this week's new highs in some of the senior
stock indices were not confirmed by a new high in the NDX/Dow ratio. As
explained many times in the past, a downward reversal in the NDX/Dow ratio
is something that should occur prior to a downward reversal in the broad
market.
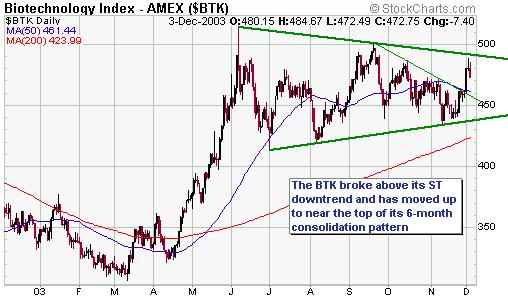
There is, however, some good news for
the bulls in that the Biotech Index (BTK) broke its short-term downtrend
early this week (see chart below). The BTK remains below a longer-term
trend-line, but its chart pattern has bullish connotations (more often
than not, patterns such as this lead to large upward moves). A drop back
to 440-450 by the BTK would not be surprising over the next few weeks,
but as long as it remains above its November low the overall pattern will
remain bullish.
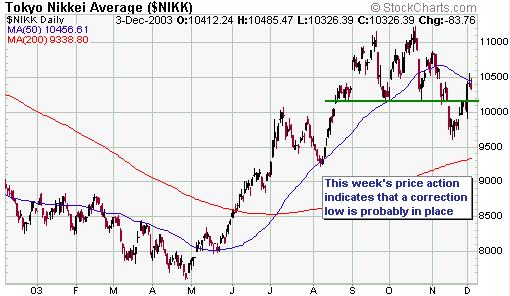
And some additional good news for the
bulls has come in the form of a sharp rebound in the Japanese stock market.
Japan's Nikkei225 Index recently broke below important support in the 10000-10200
range, but this week's surge above this range suggests that a correction
low is in place. Even if this proves to be the case, though, the Nikkei's
risk/reward is not particularly attractive to us at this time. Or, to put
it more aptly, we much prefer the risk/reward of some of the commodity-oriented
stocks.
In summary: the market appears to be
headed higher over the coming month or so, but there are some potentially
important signs of weakness. The action is consistent with a market that
is working its way towards a January peak.
Gold and
the Dollar
The Fed distorts interest rates
throughout the world
The Reserve Bank of Australia (RBA)
hiked the official Australian interest rate by 0.25% for the second time
earlier this week (the first rate hike was last month). However, according
to the US Federal Reserve there won't be any rate hikes in the US
for the foreseeable future.
The RBA might be making some attempt
to contain the inflation problem in Australia, but the Fed's current interest
rate policy -- which could appropriately be referred to as a pro-inflation
policy -- is going to severely limit the ability of central banks throughout
the world to use monetary policy in response to domestic inflation concerns.
This is because the spread between official US interest rates and interest
rates in most other developed nations is already very large. For example,
official interest rates are now at 5.25% in Australia, 3.75% in the UK,
2% in the European Union and only 1% in the US. This, in turn, means that
any central bank that tries to rein-in local inflation pressures by hiking
official interest rates is going to increase the already-wide yield differential
with the US and is therefore going to put upward pressure on its currency's
exchange rate. Since most central bankers don't want their currencies to
strengthen against the US$ they are somewhat hamstrung by the Fed's pro-inflation
stance. In other words, the Fed's current policy is going to exacerbate
the inflation problems in many other countries.
As well as distorting monetary-policy
decisions throughout the world, the Fed's pro-inflation policy should ensure
that any rebound in the US$ will be short-lived. We are anticipating a
dollar rebound, most likely beginning from near the current level, but
in the absence of a change in Fed monetary policy the magnitude of any
US$ rally would be unlikely to exceed 10%.
Barrick Gold to close its hedge
book
Barrick Gold, the gold mining company
that forward-sold (hedged) more gold than anyone else, has announced that
it is going to reduce its hedge book to zero over the next few years. Barrick's
hedge book is presently around 16M ounces, so the amount of gold that will
be available to the market over the next few years will now potentially
be 16M ounces less than it would have been had Barrick decided to maintain
its current level of forward sales. We say "potentially" because the total
aboveground supply of gold won't change as a result of Barrick's announcement
and the 16M ounces of gold that were loaned by central banks in order to
facilitate Barrick's forward sales might simply be re-loaned to someone
else as Barrick closes out its various contracts (*see note below).
The Barrick news can only be positive
for the gold market because it means that one avenue for getting official
gold reserves out of central bank vaults and into the hands of Indian jewelry
manufacturers no longer exists. However, when it comes to the 'de-hedging'
that has taken place over the past few years we've noticed that some gold
market commentators have put, and continue to put, the cart before the
horse. Specifically, it is important to understand that the gold bull
market has caused the de-hedging, not the other way around. No gold
mining companies were closing out hedges when the gold price was bottoming
during 1999-2001, but as the gold price has moved higher an increasing
number of companies have realised that it pays not to forward-sell
future production.
*Note: As part of every forward sale
of gold by a mining company an intermediary (a bullion bank) borrows gold
from a central bank and then sells the gold into the spot market. The intention
is that the central bank's loan will eventually be repaid using the mining
company's future gold production.
Gold and Silver Stocks
From the latest Weekly Update:
"The likelihood that gold stocks
won't peak until after the Dow peaks is a point we've stressed over the
past several months and is part of the reason we've been comfortable retaining
substantial exposure to the gold sector (as long as the broad market was
making new highs there wasn't any need to worry about a major decline in
the gold sector). Now, though, we are approaching a dangerous time for
the gold sector because it's been 3-4 weeks since the Dow Industrials Index
made its most recent high for the year.
Obviously, if the Dow moves to a
new high for the year over the next few weeks -- something we think it
has a good chance of doing -- then the immediate danger for the gold sector
will subside."
The Dow has just made a new high for
the year and, as discussed earlier in today's commentary, there are signs
that the broad market is headed for an important peak during the first
half of January. If this proves to be the case then the earliest
likely time for a peak in the gold sector would be late January.
The market action over the first half
of this week is consistent with the short-term forecast for the AMEX Gold
BUGS Index (HUI) included in the latest Weekly Update, that is, it is consistent
with the idea that there will be a 2-4 week pullback in the HUI followed
by a final surge during January. As also mentioned in the Weekly Update,
given how expensive many of the HUI's component stocks are relative to
the gold price the ultimate high for this index might only be 5%-10% above
the current level. There's a good chance, though, that many of the junior
stocks will move considerably higher over the next 2 months.
The below point-and-figure chart of
the HUI/gold ratio does a good job of illustrating just how extended the
large and mid-tier gold stocks are right now relative to the metal price
(refer to http://stockcharts.com/education/glossary/pointFigureChart.html
for an explanation of point-and-figure charting). Also, our HUI-Gold Oscillator,
although still comfortably below the levels that have occurred at previous
intermediate-term peaks, is now at its highest level since May of 2002
(indicating that the valuation risk in gold stocks is now higher than it
has been at any time since May of 2002). However, the trend is still up
and we haven't yet seen any significant signs of weakness.
There are two times when silver stocks
are likely to out-perform gold stocks. One is during a period when the
economy is strengthening (because the silver price is driven by industrial
demand as well as monetary demand whereas the gold price is driven almost
solely by monetary demand). And the other is during the late stages of
a rally in precious metal stocks.
The reason the silver stocks have tended
to out-perform during the late stages of rallies is that this is the time
when the most speculative stocks provide the highest returns and all silver
stocks are speculative (there are no 'blue chip' silver stocks). We say
this because the popular listed silver companies either have no revenue
(they just have silver in the ground) or if they are actually producing
silver they are small and currently unprofitable.
The below chart of the TSSI/HUI ratio
(TSSI is the TSI Silver Stock Index) shows that silver stocks have been
gaining relative to the large and mid-tier gold stocks that comprise the
HUI since July of this year and have recently moved sharply higher relative
to the gold stocks. The TSSI/HUI ratio is still well below where it was
during May-June of 2002 (when silver stocks were peaking), but the recent
performance of this ratio meshes with the view that we will get an important
peak within the next 2 months.
In the TSI Stocks List we have exposure
to silver via Western Silver, Cardero Resource and Metallica Resources.
These stocks will probably move higher over the next 2 months, perhaps
following some consolidation of recent gains, but hopefully none of our
regular readers will feel the need to buy at the current prices because
these stocks were recommended numerous times at much lower prices over
the past several months.
Gold and Currencies
A normal progression in the markets
would go something like this:
1. Gold stocks reach a major peak and
start trending lower
2. Sometime after gold stocks have
peaked the gold price peaks and begins trending lower
3. Sometime after the gold price peaks
the US$ bottoms and begins to trend higher
The time between each of the above
steps could be as little as a few days or as long as a few months.
If the markets follow the above progression
this time around and gold stocks reach a peak in late January then the
gold price isn't likely to peak and the dollar isn't likely to bottom until
at least February-March.
Our view continues to be that the Dollar
Index is close to a short-term bottom and the euro is close to a short-term
top (our previously mentioned targets were 89 for the Dollar Index and
122 for the euro). However, we won't turn short-term bullish on the Dollar
until we see a sign of strength (as mentioned in the latest Weekly Update,
we will consider a daily close in the cash Dollar Index above its 50-day
moving average to be such a sign). Also, while we were originally looking
for the dollar to experience a 3-6 month counter-trend rally following
a drop to the 88-90 range such an outcome is no longer consistent with
the current action and expected future action in other markets. Instead,
the Dollar is likely to resume its decline following, at best, a 1-2 month
rally.
Our gold market view is unchanged.
Gold is expected to move up to $410-$420 before year-end and to trade up
to $460 next year (probably during the first quarter of next year the way
things are going). Major gold rallies tend to end with large upward price
spikes and there has been no 'spikiness' in the recent gold move. Furthermore,
the longer that gold can work its way upward in such a slow and steady
manner the higher it should eventually go.
Update
on Stock Selections
 At
Wednesday's closing price of C$6.68 for NovaGold shares (TSX: NG) the NovaGold
warrants (TSX: NG.WT) are, by our calculations, worth around C$3.10. However,
these warrants closed at $2.38 on Wednesday. Needless to say (but we'll
say it anyway), the NG warrants look very attractive at the current
price. At
Wednesday's closing price of C$6.68 for NovaGold shares (TSX: NG) the NovaGold
warrants (TSX: NG.WT) are, by our calculations, worth around C$3.10. However,
these warrants closed at $2.38 on Wednesday. Needless to say (but we'll
say it anyway), the NG warrants look very attractive at the current
price.
Chart Sources
Charts appearing in today's commentary
are courtesy of:
http://stockcharts.com/index.html
http://www.futuresource.com/

|
