|
- Interim Update 3rd December 2008
Copyright
Reminder
The commentaries that appear at TSI
may not be distributed, in full or in part, without our written permission.
In particular, please note that the posting of extracts from TSI commentaries
at other web sites or providing links to TSI commentaries at other web
sites (for example, at discussion boards) without our written permission
is prohibited.
We reserve the right to immediately
terminate the subscription of any TSI subscriber who distributes the TSI
commentaries without our written permission.
Increasing Instability, Part 2
In last week's Interim Update we explained that government intervention
designed to prolong booms and curtail busts leads to a boom-bust cycle
with increasingly large oscillations (signifying increasing
instability). As part of this discussion we used a long-term chart of
the Dow/Gold ratio to pictorially represent the increasing instability.
It has since come to our attention that a similar analysis was posted last March by Steve Fairfax at http://www.lewrockwell.com/orig9/fairfax2.html.
Mr. Fairfax draws on Control Theory -- he discusses negative and
positive feedback loops, etc. -- to explain how government/central-bank
intervention is making the financial world more unstable, and, like us,
uses the expanding oscillations of the Dow/Gold ratio to help make his
point. Here's an excerpt from this excellent article:
"Correcting a credit
crisis caused by excessive debt and profligate spending requires three
kinds of negative feedback: sound money, saving, and budget cutting.
This is the opposite of our present course of money creation, more
debt, and more spending. The instability is growing because of this
positive feedback.
It was not always so.
Murray Rothbard's outstanding treatment of The Panic of 1819 documents
striking similarities to the Panic of 2008. There was speculation in
real estate fueled by over-easy granting of credit, a loss of
confidence in banks and financial institutions, a wave of bankruptcies,
and a full-blown credit crisis with a sudden loss of liquidity. Public
land sales dropped over 90%, from $13.6 million in 1818 to $1.3 million
in 1821. Those favoring government intervention proposed various forms
of debtor relief, tighter regulation of banks, inflation of the money
supply, and protective tariffs.
While today's media,
politicians, bankers, and regulators are nearly unanimous in their
calls for more aggressive creation of debt by the Fed coupled with more
regulation and spending by the government, during the Panic of 1819
nearly the opposite was true. President Monroe largely ignored the
crisis, mentioning the resulting short depression only in explanation
of declining federal revenues. Newspapers and magazines of the day
tended to support a laissez-faire approach. The New York Evening Post
wrote that "Time and the laws of trade will restore things to an
equilibrium, if legislatures do not rashly interfere to the natural
course of events.""
The probability of another Great Depression
In the minds of most rational observers it's a foregone conclusion that
the economic recession will continue for some time, but very few people
consider another major depression to be a legitimate threat. The
consensus seems to be that some additional weakness is on the cards,
but there's no chance that things will get as bad over the next few
years as they got during the 1930s. Of course, almost no one was
forecasting the Great Depression in December of 1929, either. Based on
what we've read, the consensus during the months immediately following
the 1929 stock market crash was that a period of economic weakness
probably lay ahead, but there was no chance that things would get as
bad as they were in 1870s. Not only did they get as bad, they got much
worse.
When someone claims that there is no chance of a major depression
occurring within the next few years they are betraying a lack of
knowledge about what led to the problems experienced during the 1930s.
In our opinion, if they had a good understanding of what caused the
economic malaise of the 1930s they would have to conclude that the
probability of a great depression is considerably higher today than it
was in December of 1929.
Given that a great depression actually occurred during the 1930s can't
we say that in December-1929 the probability of such an outcome was
100%? The answer is no; in December of 1929 the probability of a great
depression was very low. What caused the depression was the massive
credit expansion of the 1920s combined with numerous major policy
blunders following the bursting of the credit bubble. In December of
1929 most of these policy blunders lay in the future.
The major policy blunders we are referring to do NOT include the Fed's
failure to prevent a substantial contraction of the money supply during
the early 1930s. We are referring, instead, to government efforts to
counteract the economic downturn by promoting the further expansion of
credit, forcing prices to remain at unrealistically high levels,
increasing taxes on high-income earners, depleting the pool of real
savings by transferring savings from the private sector to the
government, and generally creating an environment in which there was
greater uncertainty and, therefore, lesser desire on the parts of
entrepreneurs to invest for the long-term. For example, both the Hoover
and Roosevelt Administrations passed laws that increased the price of
labour, which naturally led to greater unemployment. Also, to elevate
the prices of agricultural commodities the US government paid farmers
to destroy their crops, which resulted in less food and higher food
prices at a time when a larger quantity of lower-priced food would have
been extremely helpful. The recent Washington Post article linked HERE covers some of the policy blunders.
We can't quantify the probability that a great depression (or greater
depression) will occur over the next few years, but we can say that the
probability of a great depression is higher now than it was in December
of 1929. We can say this because the recent credit bubble was many
times the size of the 1920s bubble and because governments are now
making similar policy blunders to those that were made almost 80 years
ago. Moreover, the current batch of policy-makers is blundering much
more rapidly and on a much grander scale.
Is the bond market discounting deflation?
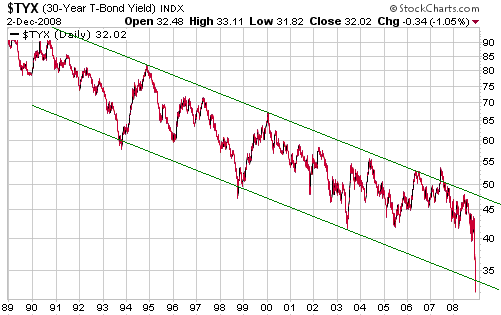
The following chart
shows that the yield on the 30-year US Treasury Bond has collapsed over
the past few weeks and is now below the bottom of its long-term
channel. The chart also makes the point that the recent decline in the
T-Bond yield is the steepest of the past 20 years.

Before attempting to answer the above question we'll put forward
another question: what was the oil market discounting when it was
pricing oil at more than $140 per barrel just 5 months ago?
The reason for asking the second question is to make the point that
market prices do not necessarily contain accurate information about the
future. In oil's case either July's price represented a wildly
inaccurate assessment of supply/demand fundamentals or today's price
does, because the supply/demand fundamentals haven't changed much in
the interim. It is true that oil demand has tapered off since July, but
it is also true that oil demand has been tapering off since the
beginning of the year. For many months the oil market was willing to
ignore the reality of falling demand because it was totally focused on
US$ weakness.
Just as oil's relentless price strength during the first half of this
year said nothing about that market's underlying supply/demand
situation, it is quite possible that the bond yield has plummeted for
reasons that have nothing to do with traditional bond-market drivers.
In particular, we think it very likely that the bond market is
discounting something other than deflation considering that the recent
spectacular collapse in the bond yield occurred after a) the stock
market had essentially bottomed, b) the US$ had essentially peaked, and
c) gold and gold stocks had begun to rally.
So, if not deflation then what is the bond market discounting?
We obviously can't say for sure, but there's a distinct possibility
that it is discounting central bank manipulation. With the yield on the
13-week T-Bill at zero and with the Fed Funds rate target likely to be
only 0.50% after this month's FOMC Meeting, there is little additional
room for the Fed to promote inflation by reducing short-term interest
rates. The bond market might therefore be sensing that the Fed is about
to turn its attention to longer-dated interest rates. If it chose to do
so, the Fed could push T-Bond yields down to some arbitrary target by
purchasing bonds using newly created money.
A central-bank price-fixing operation targeting long-term yields could
be sustained for a while, but it would add to the inflation problem
that continues to develop outside the viewing range of deflation-phobic
analysts and financial journalists. Therefore, if the Fed chose to go
down such a path it would bolster the already-strong bullish case for
gold.
The Stock Market
In Tuesday's email alert we said that although Monday's sharp decline
had breached support, it didn't change our short-term bullish outlook.
We noted that there are many positive divergences, including the large
contraction in the number of stocks making new lows.
Other significant positive divergences can be found in momentum
indicators such as the MACD and the RSI in that these indicators made
higher lows in November while the senior stock indices broke to new
lows. There is also the bullish McClellan Oscillator divergence that we
previously discussed in the 17th November Weekly Update. The chart
presented below provides another look at this divergence.
With reference to the following chart, notice that the downward trend
in the NASDAQ Composite Index over the past 7 weeks has been
accompanied by a large rise in the NASDAQ's McClellan Oscillator. This
suggests that a lot of NASDAQ-traded stocks have begun to strengthen
even while the capitalisation-weighted proxy for these stocks has
continued to weaken. In other words, it suggests that there has been
more strength beneath the surface than the performance of the NASDAQ
Composite Index would seem to indicate.
A similar positive divergence is evident in the performances of the NYSE Composite Index and the NYSE's McClellan Oscillator.
By the way, the McClellan Oscillators for both the NASDAQ and the NYSE
are near the tops of their 3-year ranges. This could mean that the
stock market will consolidate for 1-2 more weeks before embarking on an
upward trend.

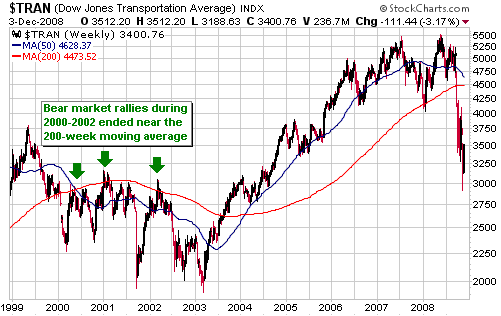
Below is a weekly chart of the Dow Transportation Average (TRAN).
The TRAN's cyclical bear market is probably not close to being over,
but as is the case with most stock market sectors the potential exists
for a substantial rebound over the coming months. How substantial?
Well, the TRAN's weekly chart shows that a) the November low coincided
with an area of long-term support near 3000, and b) all significant
rebounds during the previous cyclical bear market (the 2000-2002 bear)
ended in the vicinity of the 200-week moving average (the red line on
the chart). Therefore, if we make the reasonable assumption that the
November spike down to 3000 created an intermediate-term bottom then
the TRAN's performance during its previous bear market suggests that
there will be a rebound to the 200-week moving average over the next
few months. This, in turn, suggests upside potential of around 30% from
Wednesday's closing level.

Gold and
the Dollar
Gold
The following daily chart shows that December gold has quickly dropped
back to support at around $770. It also shows that the gold price
touched its 18-day moving average (the green line on the chart) on each
of the past two trading days. The 18-day moving average will often act
as short-term support during upward trends and short-term resistance
during downward trends.
We expect that lateral support at $770 and the 18-day moving average
will limit gold's current pullback, but if it doesn't then another test
of support at $700 could occur.

Gold Stocks
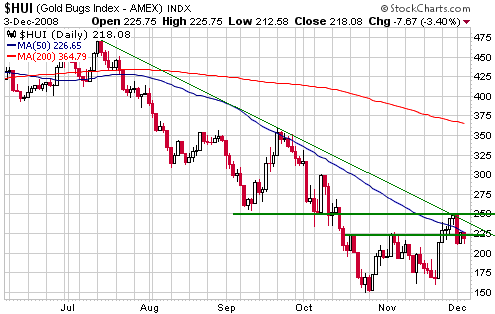
On the following daily HUI chart we show lateral resistance at 250,
lateral resistance/support at 225 (over the past 6 trading days 225 has
gone from being resistance to support and then back to resistance), and
a downward-sloping trend-line beginning at the July peak. Trend lines
drawn on charts don't determine trends; they are just lines on charts.
They can, however, have a psychological effect because so many traders
follow them.
It would have made things easier for us if the HUI's pullback from
resistance at 250 had held at or above 225, but the market is not
inclined to make things easy. This week's break below 225 doesn't
change our expectation that the HUI will move much higher over the
coming few months, but it does make the near-term outlook more
uncertain. Given that the effects of tax-related selling should
continue to be felt for about two more weeks, a probable outcome is
that the HUI will resume its upward trend just before Christmas and
will be 'choppy' in the interim.

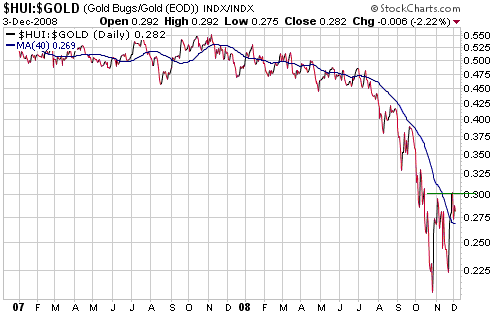
The following chart
shows the HUI/gold ratio and HUI/gold's 40-day moving average. The
rally in the HUI/gold ratio since its October bottom looks very
different to the counter-trend rebounds that occurred over the
preceding 12 months, and the difference will become even more
pronounced if HUI/gold can hold above its 40-day MA during the current
consolidation and then move above its late-November peak. Such an
outcome would be additional evidence that a major bottom is in place.

Currency Market Update
A daily chart of the December euro futures contract is displayed below.
The euro continues to 'chop' between 1.24 and 1.30, with an upside
breakout from this range still being the most likely resolution. In
anticipation of an eventual upside breakout we think it would be
reasonable for currency traders to buy the euro at 1.27 or lower and to
set a protective stop just below 1.24.
Update
on Stock Selections
(Note: To review the complete list of current TSI stock selections, logon at http://www.speculative-investor.com/new/market_logon.asp
and then click on "Stock Selections" in the menu. When at the Stock
Selections page, click on a stock's symbol to bring-up an archive of our comments on the stock in question)
 Minefinders
Corp. (AMEX: MFN). Shares: 60M issued, 77M fully diluted (including
effects of Dec08 financing). Recent price: US$3.25 Minefinders
Corp. (AMEX: MFN). Shares: 60M issued, 77M fully diluted (including
effects of Dec08 financing). Recent price: US$3.25
MFN announced on Tuesday that it has obtained about C$40M by issuing
new shares to a group of underwriters at C$4.35/share. This financing
dilutes existing shareholders and reduces the company's per-share
value, but it also reduces risk as the company ramps its Dolores
gold/silver mine up to commercial production. The Dolores mine contains
a gold-equivalent reserve of 4.25M ounces (2.44M ounces of gold +
126.6M ounces of silver) and is designed to produce 180K
gold-equivalent ounces (128K ounces of gold + 4M ounces of silver) per
year at a cash cost of around US$300 per gold-equivalent ounce.
With this financing news now 'in the market' and with the resulting
improvement in MFN's balance sheet, MFN is a good candidate for new
buying. Unless something unexpectedly bad happens during the production
ramp-up the stock should perform very well from here.
 Capital Gold Corporation (OTC: CGLD, TSX: CGC). Shares: 193M issued, 198M fully diluted. Recent price: US$0.34 Capital Gold Corporation (OTC: CGLD, TSX: CGC). Shares: 193M issued, 198M fully diluted. Recent price: US$0.34
CGLD held up better than most small-cap gold stocks over the past 6
weeks, undoubtedly because it has a strong balance sheet combined with
a very profitable and growing mining operation in Mexico. Its mining
costs are low enough that it would remain profitable even if gold were
to fulfill Robert Prechter's bearish dreams, which means that it is
much less risky than the average junior mining company. At the same
time, it offers plenty of leverage to an increase in the gold price due
to its low market capitalisation and the likelihood that its production
will increase from 50K ounces/year to 70K ounces/year over the next 12
months.
Investors with a 1-2 year time horizon should look for opportunities to
accumulate CGLD over the coming fortnight. Our intermediate-term
valuation-based target for the stock is US$1.00.
 As noted in Tuesday's email alert, Monday's market-wide plunge stopped
us out of our trading positions in Yamana Gold, Hudbay Minerals, New
Gold and Silver Wheaton at profits of 37.8%, 12.0%, 7.1% and 14.8%,
respectively. Also, we were subsequently stopped out of our new trading
position in Chesapeake Energy (CHK) for a loss of 15.0%.
The extreme volatility is making it difficult to manage risk, but we
expect that steadier -- and hence better suited for trading -- upward
trends will get underway over the next few weeks.
Chart Sources
Charts appearing in today's commentary
are courtesy of:
http://stockcharts.com/index.html
http://www.futuresource.com/
http://www.decisionpoint.com/
http://bigcharts.marketwatch.com/
http://www.economagic.com/
http://www.fullermoney.com/

|

