|
- Interim Update 4th January 2012
Copyright
Reminder
The commentaries that appear at TSI
may not be distributed, in full or in part, without our written permission.
In particular, please note that the posting of extracts from TSI commentaries
at other web sites or providing links to TSI commentaries at other web
sites (for example, at discussion boards) without our written permission
is prohibited.
We reserve the right to immediately
terminate the subscription of any TSI subscriber who distributes the TSI
commentaries without our written permission.
Brokerage risk in the
wake of MF Global
After MF Global (MFG), a US-based futures broker, went bankrupt late last year, it was discovered that a sizeable chunk of its customers' assets were missing. Although it has been widely reported that the loss of these assets is related to "re-hypothecating" (the practice via which a bank or brokerage uses the collateral deposited by its customers to back its own trades), we don't know that this is actually the case. There could be other reasons for the loss, such as 'borrowing' customer funds in a desperate effort to meet margin calls on leveraged trades that had gone wrong. Anyhow, the fact that MFG's own financial problems resulted in losses to its customers reveals a risk. After all, many people had assumed that customer funds/assets were segregated in a way that would prevent such a thing from happening. The question before us now is: does the MFG fiasco point to the need for a strategy change?
The answer is that it shouldn't require a strategy change. For a long time we've recommended that people spread their financial assets across multiple institutions and countries. The goal has always been to avoid being in the position where your finances would be severely damaged by the failure of a single financial institution or the stupid/destructive behaviour of a single government. This was the case prior to the MFG failure and is the case today.
The risk of loss has probably been lowered by MFG's collapse and the resultant disappearance of some of its customers' property, the reason being that the risk is now well known. Once a risk becomes well known there will generally be less chance of it materialising and wreaking havoc in the future. However, the fact that the risk is now out in the open doesn't mean that it has been reduced to the point where it is no longer a concern. In our opinion, if you were lucky enough not to be a customer of MFG and you haven't yet diversified your institution and country exposure then you should view the MFG episode as a warning shot. You might not get another warning shot. Oil
Update
The oil price has recently gained ground in parallel with increasing tension between Iran and the US. The increasing tension encompasses threats of economic sanctions against Iran and threats by Iran to stop the transportation of oil through the Strait of Hormuz. However, the following chart suggests that the increasing tension between Iran and "the West" was not the primary cause of the oil market's recent strength.
The chart shows that there has been a strong positive correlation between the oil price and the S&P500 Index (SPX) over the past two years and that the recent strength in the oil market is exactly what should be expected given the recent strength in the stock market. Rather than being driven by increasing fear, it seems that the oil market's buoyancy is related to a general reduction in fear and a concomitant increase in economic confidence. The decline in the Volatility Index (VIX) provides additional support for this assessment.

There's a significant probability that before this year is out there will be a large rise in the oil price driven by either a Middle-East-related supply shock or fear that armed conflict in the Middle East will crimp the oil supply, leading to a reversal in the oil-SPX relationship depicted above. This is why we strongly advise against 'shorting' the oil market, despite the likelihood that oil demand will fall this year due to a global economic slowdown.The Stock Market
The following daily chart shows that the Dow Industrials Index broke above the top of a 2-month base early this week. The breakout creates a measured objective of 13200-13300, but resistance defined by last year's peak (12800) looks like a more realistic upside target.

We remain bearish on the stock market beyond the short-term.
Gold and the Dollar
Gold and Silver
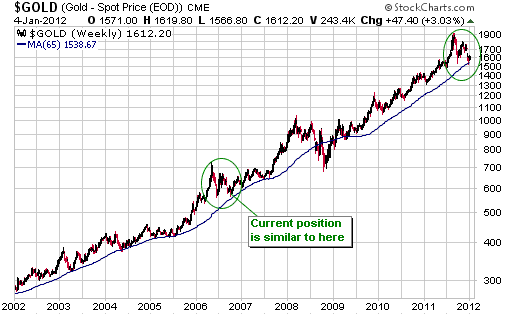
Displayed below is a weekly chart of gold that includes the 65-week moving average. There is nothing special about the 65-week moving average except that it has consistently limited intermediate-term corrections over the past 10 years, although it is worth noting that any moving average in the 60-week to 70-week range would work just as well in this regard. In fact, the only intermediate-term correction of the past 10 years that wasn't limited by the 65-week (or something close to the 65-week) moving average was the 2008 episode. That last week's low touched the 65-week moving average is evidence that the correction's price low is in place and that a base-building period has begun.
In the 19th December Weekly Update, we wrote:
"...the price action over the past 6 months looks similar to the price action during the 2006 correction. We like the comparison with 2006 because it meshes with our views that a) a short-term price low was either put in place last week or will soon be put in place within a few percent of last week's low, and b) the next major advance in the gold price probably won't begin until the final quarter of next year.
By the way, if the current correction continues to unfold in the same way as the 2006 correction then its ultimate low will be put in place within the next few weeks at marginally below the late-September low of $1532."
The current correction has continued to unfold in the same way as the 2006 correction in that gold dropped marginally below its late-September low on 29th December and then started to rally.
Note that for the 2006 correction to remain a useful model for what lies in store, gold should not close below its 29th December low ($1523) from here on.
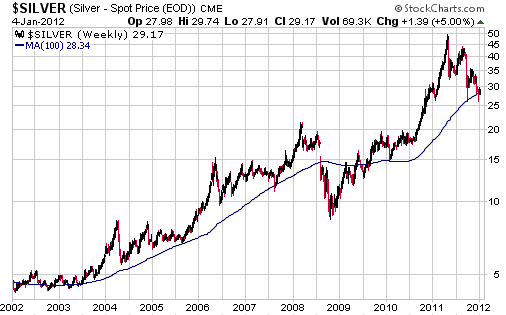
For silver, the 100-week moving average has consistently limited intermediate-term corrections over the past 10 years (the need to use a longer-term moving average with silver is a consequence of silver's greater volatility). It spiked below this moving average last week, but then quickly rebounded. As is the case with gold, the evidence suggests that silver's correction low is in place and that a base-building period has begun.
Platinum
In the 28th December Interim Update we discussed our emerging interest in owning platinum. We concluded by saying that we would probably be buyers of this metal, via PPLT, if its price fell to around $1200/oz.
The following long-term monthly chart helps to put the current platinum price into perspective. The chart shows the inflation-adjusted (IA) platinum price in current dollar terms, meaning that historical prices have been adjusted upward to reflect the estimated change in the purchasing power of the US dollar.
An implication of our chart is that although the IA platinum price is down by more than 50% from its Q1-2008 peak, it is not cheap compared to where it has traded over the bulk of the past thirty years. In terms of today's depreciated US$, platinum's average price over the past three decades was $1000-$1200. This is the range in which we'd prefer to do our buying.

Gold Stocks
Current Market Situation
Last week the HUI broke below major support at 490-500. Because the downside breakout occurred with the HUI already near an 'oversold' extreme there was a decent chance that it would prove to be false (a 'fakeout'). It's too early to know for sure, but at this stage it does appear to have been false.
As far as chart-based signals are concerned, false or quickly negated downside breakouts are more reliably bullish than upside breakouts.
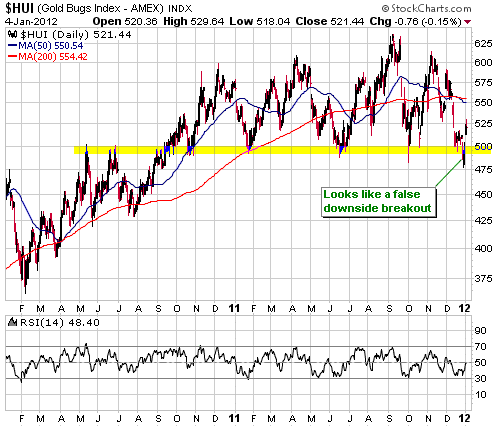
It is a little too soon to be thinking about short-term upside targets for the rally that began at last week's low. For one thing, we can't be sure yet that a sustainable low is in place. We suspect that it is, but the evidence is not conclusive. For another thing, even if a sustainable low was put in place last week it could be tested before a multi-week advance gets underway.
Investor Relations
In closely observing the junior mining world over the past ten years we've learned that stock promotion is very important. When a company relies on issuing new equity in order to fund its operations, as most listed mining juniors do, the company's per-share fundamental value can be boosted via good promotion of the stock. The reason is that the higher the stock price, the fewer the number of new shares that have to be issued to raise the required amount of money.
We've also learned that stock promotion is a task that the senior management of a junior mining company should not delegate to an external consultant. Hiring an outsider to handle "investor relations" is a waste of shareholder funds, because no well-heeled investor cares what a paid consultant says about a potential investment. It's up to the people who are running the company to tell the story and get investors interested.
If the people at the top of an exploration/development-stage mining company fail to do an appropriate amount of stock promotion, the company could still be successful if it has the right mineral asset(s). However, the company will issue more shares than it really should have issued to fund itself, meaning that the returns achieved by shareholders will probably end up being less than they should have been.
Currency Market Update
The Yen
The Japanese government is concerned that the Yen is too strong relative to the currencies of Japan's major trading partners. The concern is that strength in the Yen puts downward pressure on the profit margins of manufacturing companies that export a substantial portion of their output. The disadvantage to exporting companies resulting from Yen strength is offset by a benefit to local consumers due to lower prices for imported commodities and manufactured goods, but the advantage to consumers is considered to be of less importance than the disadvantage to certain producers. This is due to either ignorance of economics or producers having more political clout than consumers.
In any case, Japan's government wants a weaker Yen. The problem is: not everyone can have a relatively weak currency at the same time. Furthermore, chronic currency weakness or strength is largely a function of monetary inflation differentials. The Yen has been a relatively strong currency over the past several years because the rate of growth in the total supply of Yen has been relatively slow.
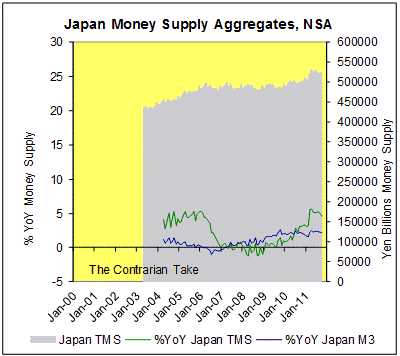
The slow rate of change in Japan's money supply is illustrated by the following two charts from
Michael Pollaro's blog. The first chart shows that over the past 8 years the year-over-year (YOY) percentage change in Japan's True Money Supply (TMS) hasn't exceeded 5% and has averaged only 2.5%. At 4.6% it is currently near the top of its range, but it now appears to be tapering off. The second chart goes a long way towards explaining the relatively slow rate of TMS growth revealed by the first chart, in that it shows BOJ (Bank of Japan) credit to be lower now than it was six years ago.
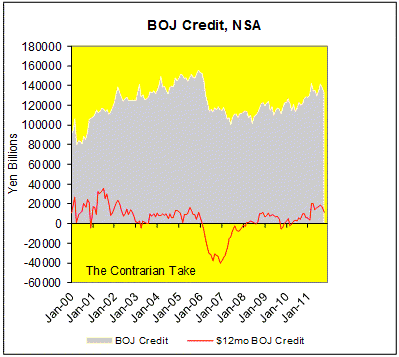
We expect that the BOJ's monetary policy will eventually become extremely 'loose'. This is because Japan's government is on an inexorable journey to the point where its only choice will be between direct debt default and large-scale debt monetisation. Left with this choice the government will very likely opt for large-scale debt monetisation via the BOJ, leading to a much weaker Yen. However, the BOJ's monetary policy has been comparatively 'tight' over the past several years and there is currently no indication that a trend change is imminent. In other words, Yen-weakening monetary inflation is probably coming, but it isn't here yet.
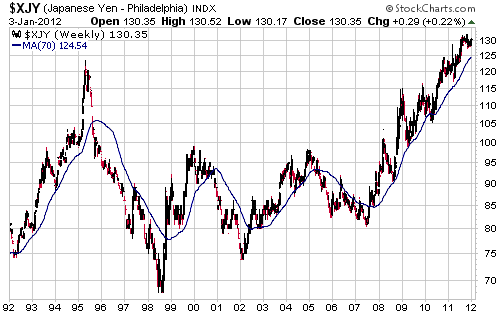
When a trend change does eventually occur it will be signaled by the Yen dropping below its 70-week moving average (MA) and staying there for a few weeks. We say this because the 70-week MA (the blue line on the following weekly Yen chart) has acted as support and resistance during all intermediate-term Yen trends over the past 20 years. Based on past performance, when the Yen next makes a sustained break below its 70-week MA it will mean that a downward trend lasting two years or more is underway.
The Dollar Index
The Dollar Index is consolidating near its December high. A normal short-term correction would take the index back to its 50-day moving average (currently at 78.4) with the possibility of an overshoot to around 77, but we don't know that a short-term correction has actually begun. It wouldn't surprise us, for example, if the dollar surged to 82-83 before commencing a routine correction back to its 50-day MA or lower. A lot obviously depends on the latest developments in the slow-motion train wreck known as European Monetary Union.

Update
on Stock Selections
Notes: 1) To review the complete list of current TSI stock selections, logon at
http://www.speculative-investor.com/new/market_logon.asp
and then click on "Stock Selections" in the menu. When at the Stock
Selections page, click on a stock's symbol to bring-up an archive of
our comments on the stock in question. 2) The Small Stock Watch List is
located at http://www.speculative-investor.com/new/smallstockwatch.html
 Crocodile Gold (TSX: CRK). Shares: 310M issued, 399M fully diluted. Recent price: C$0.53 Crocodile Gold (TSX: CRK). Shares: 310M issued, 399M fully diluted. Recent price: C$0.53
Our suggestion for holders of CRK shares is to take no action in response to Luxor Capital's bid to purchase 85% of the company at C$0.56/share. There is a chance that CRK's current managers will come up with a better deal, but if they don't and Luxor gains control of the company then there should be an opportunity to exit at a much better price later this year. This is because Luxor won't want to be a long-term owner-manager of Australian gold mines and will therefore probably find a way to profitably exit its CRK stake within the year.
 Short-Term Trades
In mid December we added three short-term trades to the TSI List (GLDX, RN.TO and VTR.TO) to reflect our belief that many of the beaten-down gold mining juniors would rebound strongly following the completion of tax-loss selling. We plan to exit these trades during the first quarter of this year.
We will obviously have to take what the market gives us, but we would welcome the opportunity to exit GLDX at around US$14. For GLDX to move up to around $14, the HUI would most likely have to rebound to the high-500s.

Chart Sources
Charts appearing in today's commentary
are courtesy of:
http://stockcharts.com/index.html

|

