![]()
![]()
![]()
![]()
- Interim Update 4th January 2017
Copyright
Reminder
The commentaries that appear at TSI
may not be distributed, in full or in part, without our written permission.
In particular, please note that the posting of extracts from TSI commentaries
at other web sites or providing links to TSI commentaries at other web
sites (for example, at discussion boards) without our written permission
is prohibited.
We reserve the right to immediately
terminate the subscription of any TSI subscriber who distributes the TSI
commentaries without our written permission.
2017 Surprises
Following the lead of Byron Wien
and Doug Kass, near the beginning of the past two years we presented a
list of potential financial-market surprises for the year ahead. These are
events/developments that are expected by very few market participants and
commentators, but in our view have either a greater than 50% chance of
happening or at least a high-enough probability of happening to be worthy
of serious consideration. Partly for fun and partly because it's a
worthwhile exercise to consider the potential outcomes that are both
realistic and widely ignored (the best money-making opportunities are
created by outcomes that have a much higher probability than most people
believe), we are doing the same this year.
Before we get to this
year's list of potential surprises, some words about last year's list are
in order. Specifically, of the ten 2016 surprises included in the 11th
January 2016 Weekly Update, which ones happened and which ones didn't?
Here are the 2016 surprises that happened or came close:
Surprise #3: "Commodity indices such as the CRB and the GNX bottom
during the first quarter of the year and have an upward bias over the
remainder of the year."
This is exactly what happened.
Surprise #4: "Following a Q1 capitulation, emerging-market equities
(as represented by EEM) begin to strengthen relative to developed-market
equities (as represented by the SPX). The EEM/SPX ratio ends the year with
a gain, which is a huge surprise to the many analysts who remain convinced
that US economic fundamentals are vastly superior to emerging-market
economic fundamentals."
This one was close enough. The EEM/SPX
ratio began to strengthen after making an early-2016 bottom and ended the
year with a very small gain. However, the percentage gain would have been
in double digits if not for dramatic post-election strength in the US
market.
Surprise #6: "The "FANG" stocks (Facebook, Amazon,
Netflix and Google), the focal points of investment demand and the leaders
to the upside over the past two years, are relatively poor performers."
This happened, as the 7.1% average gain in the FANG stocks was well
below the 12% gain in the S&P500 ETF.
Surprise #7: "The oil
price bottoms during the first quarter of the year and, despite on-going
concerns about a supply glut, experiences a trough-to-peak gain of more
than 70% on the back of increasing instability in Saudi Arabia and other
important oil-producing nations."
This happened, although the
main reason for the strong oil-price rebound wasn't increasing instability
in the Middle East.
Surprise #8: "The Yen is the strongest
major currency."
This one was close enough. Despite its large
September-December decline, the Yen out-performed every major currency
over the course of 2016 with the exception of the Canadian dollar.
Relative to the Canadian dollar it was flat.
Surprise #9: "Gold
has a 'choppy' upward trend as part of a long-term basing pattern, but the
big story is the performance of the gold-mining sector. The gold-mining
indices outperform gold by a wide margin."
Gold's rise was
certainly 'choppy' and the gold-mining indices did, indeed, outperform
gold by a wide margin.
And here are the speculated 2016 surprises
that didn't come close:
Surprise #1: "The US economy enters a
recession during the first quarter of 2016, although, as per its normal
practice, the NBER (the official recession adjudicator) doesn't officially
confirm the recession's early-2016 start until about 12 months later."
The NBER is definitely not going to record a recession as having begun
in 2016, so this didn't happen.
Surprise #2: "The S&P500 Index
(SPX) suffers a peak-to-trough decline of more than 20% and ends the year
with a loss of more than 10%."
This and Surprise #10 were
furthest from coming to pass.
Surprise #5: "...The US 10-year
T-Note, which yielded 2.13% at the end of last week, finishes the year
with a yield of more than 3%, while euro-zone government bonds perform
much worse and experience much larger yield increases."
Due to
impressive rebounds in government bond yields during the second half of
2016 this surprise was closer to happening than seemed possible at
mid-year, but the 10-year yield ended 2016 about 0.5% below 3% and
Germany's 10-year Bund yield ended the year slightly lower than it began
the year.
Surprise #10: "The uranium price rises above
$50/pound."
Uranium ended up being surprisingly weak rather
than surprisingly strong.
Now, in no particular order here's our
list of potential 2017 surprises:
1) Despite some first-half
weakness due to more "Brexit" uncertainty, the British Pound ends the year
as the strongest major currency.
2) Natural gas (basis the nearest
US futures contract) trades above $5 (current price: $3.27) and the
oil/natgas ratio (the oil price divided by the natgas price) drops from
its current level of 16.3 to below 8.
3) The Chinese Yuan loses
more than 10% of its value and makes a new 10-year low relative to the
US$.
4) The S&P500 Index (SPX) trades below 2000 within the first
half of the year; in other words, at some point during the first half of
2017 the SPX trades at least 11% below its 2016 closing level.
5)
The general perception that "inflation" is a problem emerges during the
second half of the year.
6) The 10-year Treasury yield is
unexpectedly volatile, falling below 2% during the first half of the year
in response to stock-market weakness and constructive sentiment and then
rising above 3% before year-end in response to the emerging fear of
"inflation".
7) Due to financial-market volatility, the Fed makes
only one rate hike.
8) The "FANG" stocks (Facebook, Amazon, Netflix
and Google) continue to underperform the broad market.
9) Trump
becomes increasingly erratic over the course of the year as he finds out
that his ability to control economic and financial-market outcomes is
minimal. A consequence is that there are multiple high-profile
resignations from his cabinet.
10) Greece has one of the world's
best-performing stock markets.
US Recession Watch
The ISM Manufacturing New Orders
Index (NOI) is the most reliable short-term leading indicator of US
recession, which is why it is one of the few economic data points that we
regularly discuss at TSI.
The latest NOI (the number for
December-2016) was reported on Tuesday of this week. As illustrated by the
following chart, it rose to a 2-year high and is now well above the level
it would have to drop below (the red line on the chart) to warn of an
imminent start to a recession.
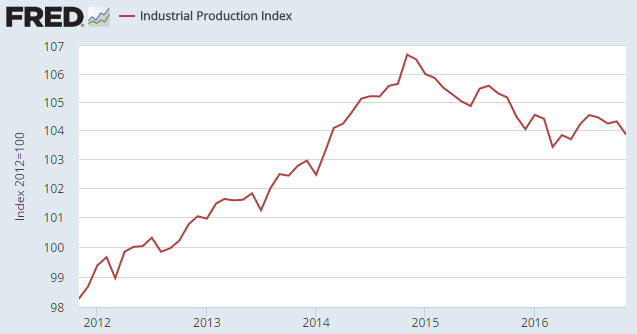
The ISM Manufacturing NOI tends to lead the Industrial Production
Index (chart included below) by about 6 months at turning points. The
strong rebound in the NOI since bottoming in August of last year therefore
suggests that US industrial production, which is presently not far from a
3-year low, will begin to rebound by March of this year.
The message of the ISM Manufacturing NOI, the most reliable short-term
recession indicator, is that a US recession will not begin EARLIER than
the second quarter of 2017. At the same time, the message of Real Gross
Private Domestic Investment (RGPDI), the most reliable long-term indicator
of US recession, is that a US recession will not begin LATER than the
second quarter of this year.
The combined message of the two
indicators could therefore be interpreted as: a recession should begin
during the second quarter of this year. However, we aren't confident that
this is the correct interpretation. The reason is that due to the
extraordinary interventions on the monetary front and the likelihood that
-- for the first time ever, as far as we can tell -- "fiscal stimulus"
will be implemented in the US with the economy in the late stages of an
expansion, the time from a downward reversal in RGPDI to the start of a
recession could be longer during the current cycle than during any
previous cycle.
The Stock Market
The US
When the NASDAQ100 Index (NDX) closed below 4900 at the end of December it
opened up the possibility that the preceding upside breakout was false. It
rebounded over the first two trading days of January and is back above
4900, but this doesn't tell us much. It now needs to either close below
its end-December low to confirm the short-term bearish signal or above its
December high to indicate that the short-term upward trend that began in
early-November is intact.
Short-term momentum and sentiment indicators are neutral, so there is
scope for significant moves to the upside or the downside over the next
few weeks. Sorry we can't be more definitive, but that's the way it is.
Although we don't have a strong opinion on which way the market will
break over the weeks ahead, it is fair to say that we are short-term
bearish on a risk/reward basis. In other words, we think there is greater
short-term downside potential following a break below the late-December
low than upside potential following a break above the December high. This
is due to our longer-term concerns about sentiment (the likelihood that at
some point over the next few months the realisation will take hold that
Trump's policy choices will not bring about a significant economy-wide
improvement in corporate earnings) and valuation. At some point, long-term
issues become short-term issues.
Emerging Markets
The Emerging Markets Equity ETF (EEM) has rebounded from support at
$34 to slightly below a confluence of resistance at $36. If it gets past
resistance at $36 then it will probably test the 2016 high near $38.
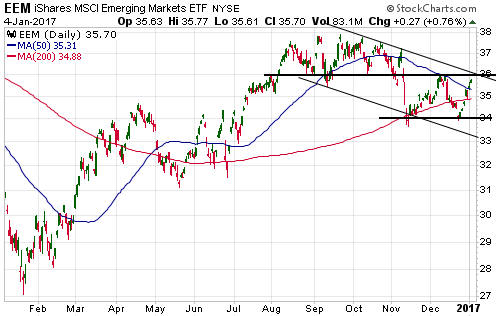
We will be surprised if EEM gets through resistance at $36 and even
more surprised if it breaks above $38 within the next two months. That
amount of short-term strength in EEM would probably be associated with a
strong broad-based rally in commodity prices, which certainly wouldn't
create a problem for us (many of our equity positions would benefit from
such an eventuality) but is not the most likely short-term outcome.
We think the most likely short-term outcome involves market moves that
help our gold-related equity exposure and hurt our non-gold equity
exposure. These moves would include weakness in industrial commodity
prices and general stock-market weakness, with "emerging-market" equities
potentially getting hit harder than developed-market equities.
We
are therefore going to buy some EEM put options with a March-2017 expiry
date to hedge our non-gold equity exposure. If these put options don't
turn out to be profitable it will probably mean that our non-gold equity
positions have better short-term performance than we currently anticipate.
Gold and the Dollar
Gold
The
US$ gold price is continuing to slowly rebound from its mid-December
bottom. This rebound is expected to at least result in a test of lateral
resistance near $1200. If that resistance is breached it will mean that a
rise to the vicinity of the 200-day MA is probably in store.
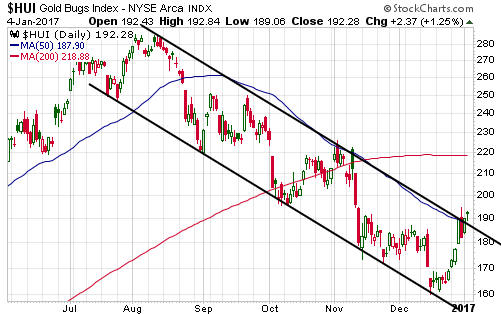
Gold Stocks
The HUI's decline from its Q3-2016
peak is clearly defined by the channel drawn on the following chart. It
closed above the top of this channel on Wednesday 4th January.
Wednesday's breakout is marginal at present. It would, however, be
solidified by an additional gain of at least a few points on Thursday 5th
January.
If the HUI can make it up to 195-200 before the end of
this week then the channel top would be positioned to act as support
during a subsequent multi-day correction. This would set the stage for a
rise to at least 220 and potentially as high as 250 within the first
quarter of 2017.
We continue to expect a Q1-2017 move up to at
least 220.
Bolstering the view that there is significant additional upside in
store for both the gold-mining sector and gold bullion over the weeks
ahead is the recent strength in the gold-mining indices relative to gold
bullion.
As illustrated by the following chart, the HUI/gold ratio
has broken decisively above its 40-day MA (the blue line on the chart). A
breakout in the HUI/gold ratio above its 40-day MA doesn't always lead to
substantial strength, but following a large decline it is a prerequisite
for substantial strength. In other words, it doesn't necessarily imply
that a lot more strength is coming, but there is definitely not going to
be a lot more strength without it.
The Currency Market
The Euro
The currency market is drawing out the suspense
with regard to whether the euro will follow-through on its break below
major support at 105 or paint the downside breakout as a false signal and
rally for 1-3 months. We are leaning towards the latter scenario, but it
will take a daily close above 106 to indicate that this scenario is in
play.
On Wednesday 4th January the euro closed right at the 105
breakdown level, having probed the top and bottom of its recent narrow
range over the preceding two trading days.

The Yuan
China's currency, the
Yuan, has been steadily working its way downward relative to the US$ for
almost three years. The Yuan's total peak-to-trough decline relative to
the US$ is about 12%.
However, over the same period the Yuan gained about 14% relative to
the euro and is flat relative to the Yen. It is therefore not fair to say
that the Yuan has been a weak currency over the past few years.
According to Donald Trump, the Chinese Government has been trying to
manipulate its currency downward, that is, lower the Yuan/USD exchange
rate, to obtain an unfair trade advantage. This is demonstrably false, as
it's a fact that China's Government has been trying to counteract the
downward pressure on the Yuan stemming from large capital outflows by
selling-off its US$ reserves. Far from trying to manipulate the Yuan/USD
rate downward, China's Government has been trying to prop it up.
The Yuan looks 'oversold' on the above chart and could rebound for a
while, but eventually a point will be reached when China's Government
tires of 'throwing good money after bad' and lets the Yuan/USD ratio fall
to a level at which the Yuan is not substantially over-valued and can be
supported at a low cost. There's a decent chance that this point will be
reached during 2017.
Updates on Stock Selections
Notes: 1) To review the complete list of current TSI stock selections, logon at
http://www.speculative-investor.com/new/market_logon.asp
and then click on "Stock Selections" in the menu. When at the Stock
Selections page, click on a stock's symbol to bring-up an archive of
our comments on the stock in question. 2) The Small Stock Watch List is
located at http://www.speculative-investor.com/new/smallstockwatch.html
Chart Sources
Charts appearing in today's commentary
are courtesy of:
http://stockcharts.com/index.html
http://bigcharts.marketwatch.com/
![]()