![]()
![]()
![]()
![]()
- Interim Update 4th May 2016
Copyright
Reminder
The commentaries that appear at TSI
may not be distributed, in full or in part, without our written permission.
In particular, please note that the posting of extracts from TSI commentaries
at other web sites or providing links to TSI commentaries at other web
sites (for example, at discussion boards) without our written permission
is prohibited.
We reserve the right to immediately
terminate the subscription of any TSI subscriber who distributes the TSI
commentaries without our written permission.
US Economic Numbers
Conflicting Information
Businesses in the US have been cutting back on capital investment for the past
few years. This is an effect of the Fed's monetary policy, in that the
suppression of interest rates has encouraged stock buybacks and debt-financed
M&A at the expense of the capital investment that leads to greater productivity
and economic progress. Although GDP is a very poor measure of economic
performance, the lacklustre pace of business investment is consistent with the
unusually slow pace of GDP growth. At the same time, the lacklustre pace of
business investment is completely at odds with the reported improvement in the
jobs market.
As Jeffrey Snider pointed out in
a recent article, unless employers and businesses are now two separate
categories unrelated to each other it makes no sense to acknowledge that
businesses are cutting back on investments with a severity and at the same time
to claim that employers are ramping-up their hiring. However, many mainstream
economists and financial journalists have done exactly that -- in reaction to
the reported statistics, which, as noted above, are at odds with each other.
There are three possible explanations for the divergence between
business-investment and employment indicated by the official US economic
numbers. The first is that the investment numbers have been manipulated by the
government in an effort to make the economy look weaker than it really is. This
is completely implausible, because the government always tries to create the
impression that things are better than they are and because private-sector
numbers are consistent with the lacklustre business-investment numbers reported
by the government.
The second possible explanation is that the employment numbers have been
manipulated by the government in an effort to make the economy look stronger
than it really is. This is plausible and is probably part of the true story, but
we think that the third explanation is the most plausible.
The third explanation is that the employment numbers are completely useless as
economic indicators. The employment statistics dutifully reported each month by
the BLS contain so many dubious assumptions and sources of error that they are
little better than if they were randomly selected by a computer from within a
pre-determined range.
But please don't tell the Fed. The policy-making members of the Fed depend on
these numbers like a sailor tossed overboard into a rough sea depends on a
flotation device.
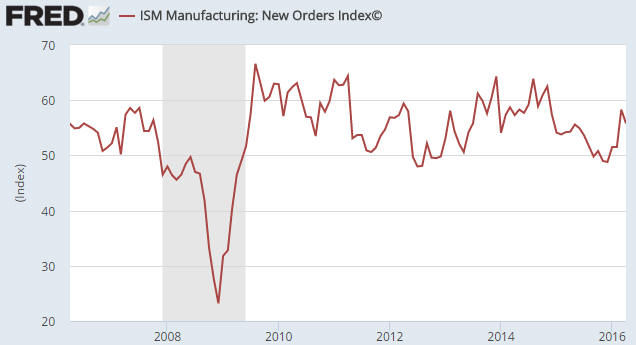
No recession signal, yet
Despite being in the sweet spot of the economic cycle, the US economy has been
sluggish for years. However, up until now it has managed to stay out of
recession territory.
After coming close to signaling a recession late last year, the ISM New Orders
Index rebounded strongly in March. The April number (published early this week)
was 2.5 points lower than the March number but was still comfortably above the
level that would point to a recession (an imminent recession is signaled by a
decline in this index to below 48).
The US economy is essentially in an economic no-man's land. It can't achieve
strong real growth, because the Fed keeps falsifying price signals and
incentivising unproductive spending. At the same time it is not in recession.
The Stock Market
The US
The NASDAQ100 Index (NDX) tested important support at 4300 last week and tested
it again on Wednesday 4th May. We are guessing that this support will hold for
now and that the decline from the April high will be partially retraced before a
much larger decline gets underway. However, if this support is breached without
there first being a 5-10 day rebound it will indicate that the market is
structurally even weaker than we think.
The SPX has been stronger than the NDX over the past month, but it too is
approaching a significant support level. For the SPX, support lies at 2040.
A breach of 2040 would suggest a near-term downside target of 2010-2015, which
is where the 200-day MA currently lies. We will be surprised if the 200-day MA
is decisively breached this month, but we are betting that it will be decisively
breached next month.
Whereas the NDX and the SPX have dropped back to significant support levels and
are well below last year's highs, the Dow Utility Average (UTIL) is in a very
different position. As illustrated below, it has moved sharply higher over the
past three weeks and is now testing its April high. Furthermore, its April-2016
high is its all-time high, so UTIL is very close to making a new all-time high.
UTIL has been lifted by strength in the bond market and the associated decline
in interest rates. It is a very risky proposition at current levels, because
even if long-term interest rates were to fall further the historical record
suggests that UTIL would be hit hard if there were a large decline in the broad
stock market.
Gold and the Dollar
Gold
In a post at
the TSI Blog prior to Wednesday's trading session we noted that the US$ gold
market was positioned in way that it could soon generate a useful clue about
future prospects. That's still the case.
Useful information would be provided by either a weekly close above last year's
high of $1308 or an intra-week rise above $1308 followed by a failure to end the
week above this level. In other words, this particular clue about the future
requires that gold at least trade briefly above $1308.
In addition, useful information about what's in store for gold could arrive on
Friday 6th May in the aftermath of the next monthly US employment report.
Regardless of what it says about the employment situation this report won't
alter gold's short-term price trend, but the gold market's reaction to the
report could provide a clue as to whether or not the short-term price trend has
reversed from up to down. For example, resilience in the gold market following a
strong employment report would suggest that the gold price was still in a rising
trend, whereas a price decline following a weak employment report would suggest
that the trend had reversed direction.
At this stage, what we have is a break above short-term resistance last week
followed by a pullback to test the breakout over the first three days of this
week (see chart below). A daily close below $1260 would clearly mark last week's
upside breakout as false, which means that a daily close below $1260 would also
be informative.
We now sit back and wait for more information.
Gold Stocks
On a short-term basis the HUI is in a similar position to gold, having broken
out to the upside last week and pulled back -- via three consecutive down-days
-- to test its breakout over this week to date. The difference is that last
week's up-move in the HUI took it above both short-term and intermediate-term
resistance, in that the 210 level for the HUI is equivalent to the $1308 level
for gold.
Last week's break above 210 suggested that the HUI could reach its 200-week MA
(a likely target for an intermediate-term top) as soon as the first half of May.
The 200-week MA is at 240 and Monday's high was 236, so the target has
essentially been reached.
With the HUI's rally from its January bottom having come very close to achieving
the most that the first intermediate-term advance in a gold-mining bull market
can reasonably be expected to achieve and with the gold-mining indices having
just experienced three consecutive down-days for the first time since the
January bottom, it's certainly possible that an intermediate-term top is in
pace. However, the evidence of a top is far from conclusive at this time. For
example, rather than this week's reversal marking a multi-month top, it could be
marking a shift to a higher-volatility final phase of the rally.
In any case, with the HUI having reversed downward after going almost as high as
the first intermediate-term advance in a bull market should go, we are now
intermediate-term neutral on the gold-mining sector. There is still a chance of
a final surge to a new high for the year within the coming few weeks, but our
guess is that the HUI will end this year within 15% of its current level.
We think that downside risk for the HUI over the days ahead is limited by
support at 190.
Before moving on it's worth noting that even if gold-mining indices such as the
HUI have already peaked on an intermediate-term basis, some individual gold
stocks will probably make new 12-month highs within the next several weeks.
The Currency Market
A potential British Pound trade
UK voters will go to the polls on 23rd June to decide whether the UK stays-in or
leaves the European Union (EU). We think that the UK will fare much better both
economically and socially over the years ahead if voters say yes to "BREXIT"
(leaving the EU), but regardless of the outcome of the vote we are becoming
interested in being 'long' the Pound for a short-term or an intermediate-term
trade. The three reasons are the chart-related evidence of an intermediate-term
bottom, the UK's relatively slow rate of monetary inflation and the volatility
that will stem from the upcoming "BREXIT" vote.
The first reason for our interest in accumulating a long position is illustrated
by the following chart, which shows that a potential base has formed over the
past four months. Ideally (to create the best set-up for a long position), the
price will pull back to around 143 to test the April breakout before resuming
its advance.
The second reason is illustrated by the following chart of the UK monetary
inflation rate (our chart uses the retail M4 number published monthly by the
BOE). This chart shows that the rate of increase in Pound supply has averaged
around 4%/year over the past 7 years (low relative to the US and the euro-zone)
and is presently near the bottom of its 7-year range, which means that a
stronger Pound is supported by the supply side of the equation.
The third reason is the potential for large fluctuations in the Pound's value
relative to the US$ in anticipation of and in reaction to the 23rd June BREXIT
vote. These fluctuations could provide opportunities to buy at depressed levels
and opportunities to take profits.
Our rough plan is to accumulate half of a full position during periods of
weakness prior to the BREXIT vote. We would then either double the position
following a sharp sell-off in reaction to a "yes" vote (although a "yes" vote
would be a long-term plus for the UK, the knee-jerk market reaction would
probably be a mini-panic out of the Pound) or take profits following a relief
rally in reaction to a "no" vote.
A position in the Pound could, for example, be taken by converting a bank
deposit from another currency to Pounds, purchasing Pound futures, purchasing
FXB (CurrencyShares British Pound ETF), or, for those who want more leverage and
are prepared to take a much greater percentage loss if the trade doesn't work
out, purchasing call options on Pound futures or FXB. Our intention at this time
is to convert part of an existing currency deposit to Pounds and to purchase
some September FXB call options.
As mentioned above, the price will ideally pull back to around 143 to test the
April breakout before resuming its advance.
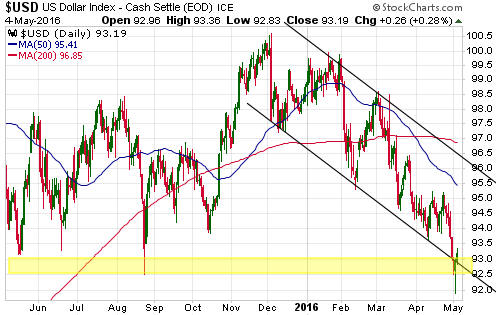
The Dollar Index
In the latest Weekly Update, we wrote:
"The Dollar Index is likely to give either a bullish signal or a bearish
signal this week. A bullish signal would be generated by an intra-week spike
below the bottom of the 16-month horizontal range followed by a recovery to end
the week back inside the range (a false downside breakout). A bearish signal
would be generated by a weekly close below the bottom of the horizontal range."
The price action over the first three days of this week has opened up the
possibility of a bullish signal in the form of a false downside breakout, but
such a signal depends on the Dollar Index ending the week above 93.
Updates on Stock Selections
Notes: 1) To review the complete list of current TSI stock selections, logon at
http://www.speculative-investor.com/new/market_logon.asp
and then click on "Stock Selections" in the menu. When at the Stock
Selections page, click on a stock's symbol to bring-up an archive of
our comments on the stock in question. 2) The Small Stock Watch List is
located at http://www.speculative-investor.com/new/smallstockwatch.html
![]() Ivanhoe
Mines (IVN.TO) recently had the honour of having its Kamoa project in the
DRC named by the Mining Journal as the world's best undeveloped copper project.
This news prompted Rick Rule, the CEO of Sprott US Holdings and an IVN
shareholder, to interview Robert Friedland, IVN's CEO. You can listen to the
interview
HERE.
Ivanhoe
Mines (IVN.TO) recently had the honour of having its Kamoa project in the
DRC named by the Mining Journal as the world's best undeveloped copper project.
This news prompted Rick Rule, the CEO of Sprott US Holdings and an IVN
shareholder, to interview Robert Friedland, IVN's CEO. You can listen to the
interview
HERE.
The Rule-Friedland interview does a good job of outlining the unique speculative
opportunity represented by IVN. For example, the following points are made:
1) As noted above, the Kamoa project is arguably the best undeveloped copper
project in the world. The project is a joint venture between IVN and China's
Zijin Mining.
2) Given the deal done with Zijin and the equity/spending already contributed,
IVN is effectively financed through to production at Kamoa.
3) Kamoa will probably be economic at a copper price of $2/pound once new
discoveries are incorporated into the resource.
4) In addition to Kamoa, IVN owns the Platreef (South Africa) and Kipushi (DRC)
projects.
5) Platreef is the largest undeveloped PGM project in the world and Kipushi is
possibly the world's best undeveloped zinc project (the grade of the deposit is
an incredible 40% zinc-equivalent).
6) The company's mineral resources are the result of US$1.3B of drilling over
the past 18 years.
7) The company is debt free and almost all of its spending is discretionary.
8) Deals similar to the one that was done with Zijin at Kamoa could be done at
IVN's other projects, injecting large amounts of cash into IVN and avoiding the
need to issue new shares to finance future development.
9) Despite this remarkable portfolio of assets, the stock is being valued by the
market at only slightly more than cash value (the company has about C$0.93/share
of cash).
Assuming that commodity prices have begun to turn the corner, at some point over
the next couple of years IVN is likely to grab the investing community's
attention and experience a huge rise in market value. The main company-specific
risk is the DRC (Democratic Republic of the Congo) location of its two most
important assets (Kamoa and Kipushi).
Chart Sources
Charts appearing in today's commentary
are courtesy of:
http://stockcharts.com/index.html
http://research.stlouisfed.org/
![]()