|
- Interim Update 4th August 2004
Copyright
Reminder
The commentaries that appear at TSI
may not be distributed, in full or in part, without our written permission.
In particular, please note that the posting of extracts from TSI commentaries
at other web sites or providing links to TSI commentaries at other web
sites (for example, at discussion boards) without our written permission
is prohibited.
We reserve the right to immediately
terminate the subscription of any TSI subscriber who distributes the TSI
commentaries without our written permission.
The US
Stock Market
Oil and the stock market
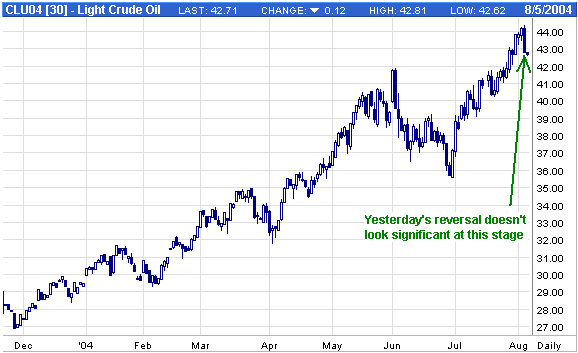
The oil price continued its relentless move higher during the first two
days of this week, but then made a sharp downward reversal on Wednesday
(refer to the daily chart of NYMEX September oil futures below) after
the US Department of Energy reported that a) inventories of gasoline
and distillates each rose by more than 2M barrels last week, b) growth
in gasoline demand has stalled out, and c) inventories of heating oil
will be at normal levels when the winter begins. At this stage
yesterday's downward reversal in the oil market doesn't look
particularly significant, but it was sufficient to encourage a rebound
in the stock market following a sell-off earlier in the day.

Persistent strength
in the oil price from here is not a prerequisite for a sharply lower
stock market (there are other reasons why the stock market is likely to
move lower over the coming months), but if the oil price continues to
push higher an eventual result will be a much weaker stock market. This
is not just because rising energy prices act like a tax increase but
also because there has been a positive correlation between the oil
price and short-term US interest rates over the past 6 months (rising
energy prices have been putting upward pressure on short-term interest
rates).
Current Market Situation
The senior US stock indices continue to meander along within the broad
channels that have defined their progress since the beginning of this
year, making it devilishly difficult to make money on either the short
side or the long side. We continue to anticipate a large break to the
downside, but considerable patience has been required over the past
several months and might be required for a while longer as a definitive
breakout remains elusive.
The recent tests of their respective May lows by the S&P500, the
Dow and the NASDAQ have predictably led to rebounds which could
continue for at least another fortnight, particularly if the pressure
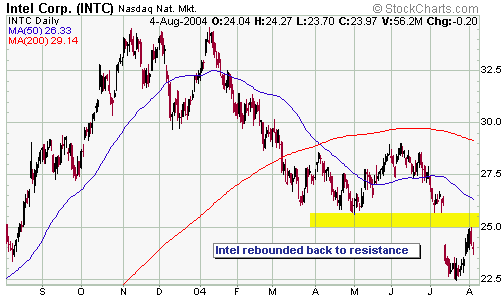
in the oil market has temporarily abated. However, the stock price of
tech bellwether Intel has already rebounded back to a logical
resistance level (see chart below) and reversed lower, so it is quite
possible that the market will resume its decline without first moving
appreciably higher.

The problem we have
right now is that we can't divine much at all from the technical and
sentiment indicators. There are what look like intermediate-term
topping patterns all over the place, but that has been the case for a
few months now. At the same time, we can see that it would be possible
to make a short-term bullish argument. For example, the Semiconductor
Index has begun to rebound from near the bottom of a well-defined
channel and the recent action in the ever-important Bank Index could be
interpreted as a saucer-type bottoming pattern.
Unfortunately, if we
look outside the US for clues as to what to expect in the near future
we see an equally fuzzy picture. Japan's Nikkei225 Index, for instance,
dropped quite sharply over the past month but stopped falling once it
hit trend-line support. In other words, there hasn't yet been a
significant breakdown.
By the way, although
we think a sharp (10%-15%) decline in the stock indices remains a good
prospect at some point between now and October, the best opportunity to
generate some trading profits will probably come from 'going long'
during the rally that will most likely follow a sharp break to the
downside. Until we get a sizeable decline, though, we won't be giving a
great deal of thought to the possibility of a tradable rally.
Gold and
the Dollar
Why hold gold stocks at all?
Our view that the US$ will trend higher over the next several months
and, as a consequence, that gold stocks are likely to trade at lower
levels at some point between now and November, has prompted questions
from subscribers along the lines of: Why do we suggest maintaining a
sizeable position in gold stocks in the current environment? Wouldn't
it be better to just get out of all gold stocks and re-enter later this
year once the corrective activity comes to an end and the next major
advance gets underway?
Well, getting out of all gold stocks would be a reasonable thing to do
if we could be absolutely CERTAIN that the stocks we own were going to
trade significantly lower in the future, but that isn't the case.
Rather, there's a good CHANCE that the stocks will be available at
lower levels before year-end, but this is a reason to be cautious and
to maintain higher-than-usual cash reserves (something we've been
strongly advocating since January); it is not a reason to be completely
out of the market.
Being completely out of gold stocks would be akin to betting everything
on a single short- or intermediate-term call and would, in our opinion,
fly in the face of sensible risk management practice. The reason is
that while most gold stocks will PROBABLY be available at lower levels
the magnitude of the upside risk is generally many times greater than
the magnitude of the downside risk. We can show what we mean by this by
doing a 'back of the envelope' valuation of NovaGold (TSX, AMEX: NG).
If things go roughly to plan then NG will have annual gold production
of around 700,000 ounces by 2008. Currently, the average market cap per
ounce of gold production across the entire gold sector is around
US$2000, so the aforementioned production would be valued at around
US$1.4B if the gold price were near current levels (a higher gold price
would increase the value of gold production). Now, assuming that NG has
to issue another 10M shares over the next 4 years in order to finance
project development -- a reasonable assumption given the company's
current cash reserves and the likelihood that earlier projects will
provide the cash to finance later projects -- then a US$1.4B market cap
in four years time would be equivalent to a stock price of US$19
(C$25).
The above-calculated price of C$25/share for NG is 280% higher than
yesterday's closing price of C$6.44 and, as mentioned, assumes ZERO
increase in the gold price. However, we expect that the gold price will
be trading well north of US$1,000 by 2008 so the actual stock price
could be MUCH higher than our calculated value.
So, that's the potential upside over the next few years for one of our
stocks and against this we must balance the risk of a drop back to
around C$5.00 at some point over the next few months.
Most gold stocks don't have NovaGold's growth prospects so the above
example is not representative of the sector as a whole. As far as the
overall gold sector is concerned, though, a similar argument can be
made in that the upside potential over the next few years can be shown
to dwarf any short- or intermediate-term downside risk. In particular,
with current sentiment towards the gold sector ranging from disinterest
to pessimism (refer to the below discussion on gold market sentiment)
the probability of another large down-swing in the prices of gold
shares is low. What would, instead, be more likely is a drop back to
near the May lows or, perhaps, to a few percent below the May lows; and
against this downside risk we must balance the potential for another
multi-year advance of similar magnitude to the one that unfolded during
2001-2003.
When it comes to gold stocks something else that unfortunately needs to
be taken into account at this time is the very real potential for
another large-scale terrorist attack. As discussed in the 26th July
Weekly Update, gold stocks would probably get hit hard if the broad
stock market tanked UNLESS the reason for the plunge in the stock
market was terrorism, in which case gold stocks would move sharply
higher if the September-2001 experience was anything to go by. In other
words, at this time it might be appropriate to hold some gold stocks as
a hedge against a financial crisis brought on by the destructive acts
of barbaric terrorists.
Further to the above, we think it's important to be aware of the
downside risks in the gold sector as far as the next several months are
concerned, but not to allow the potential for additional counter-trend
moves in gold and the US$ to completely override our longer-term views
and all other considerations.
Gold Market Sentiment
TSI is not a "gold newsletter", but as mentioned in a previous
commentary the level of interest in the TSI web site tends to ebb and
flow with the level of interest in gold-related investments.
Specifically, when rising prices cause the public to become more
enthusiastic about gold and gold shares we see an increase in
subscriptions (trial subscriptions and paid subscriptions) whereas the
level of interest in the TSI service invariably drops off during
corrections in the gold market. In this respect this year's gold market
correction has had a similar effect as the corrections that occurred
during 2002 and 2003, and even though the prices of gold and gold
stocks have made a moderate recovery over the past 2.5 months it
appears as if sentiment has remained quite depressed.
Other sentiment indicators paint a similar picture to our experience at
TSI. For example, the commitments of traders (COT) data show that small
traders were only marginally more bullish on gold with the gold price
trading above $400 in July as they were when gold was trading in the
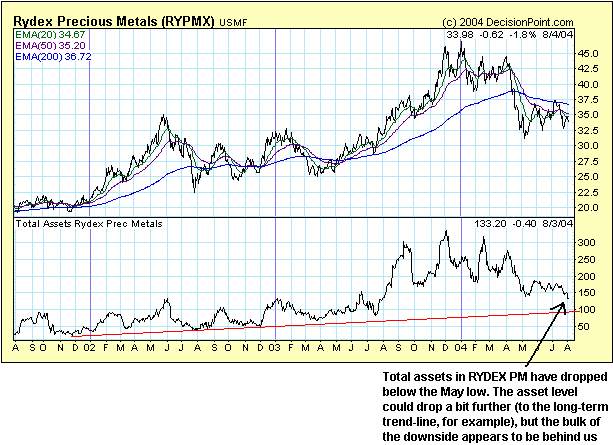
370s during the first half of May. Also, the below chart shows that the
total assets in the Rydex Precious Metals Fund are now less than they
were when gold and gold stocks were near their lows in May. In other
words, since the May bottom the public has continued to lose interest
in gold-related investments. This is, of course, bullish from a
contrarian perspective and should help to limit the downside from here
because it means that a lot of the weak hands are out of the market.

Current Market Situation
The below chart of Newmont Mining (NEM), the world's leading gold stock
and a reasonable proxy for the gold sector, shows that $40.50 has acted
as support and resistance over the past 6 months. Right now it
represents important resistance.
With NEM turning lower on Wednesday after testing resistance at $40.50
during each of the preceding three trading days it appears as if the
resistance has held and that a drop back to near the May low is on the
cards. This is our favoured scenario and as far as we are concerned the
sooner we can get a test of the May low out of the way the sooner we
can commence the next major advance in the gold-stock bull market.
The most likely TIME
for a correction low in the gold sector is November, but as discussed
in recent commentaries it might be possible to bring the timing of a
low forward to mid August if there is sufficient weakness during the
first half of this month. Alternatively, we could get a test of the May
low during August followed by a rebound and then a second test during
November. Such a pattern would be similar to what happened during the
2002-2003 correction in the gold sector and to the lengthy mid-cycle
correction experienced by the S&P500 during 1994.

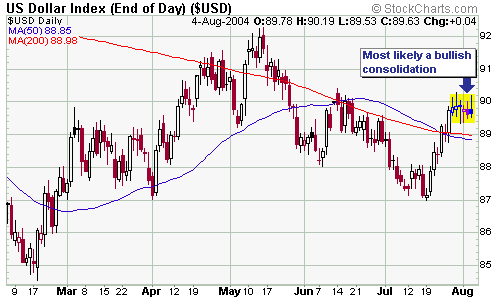
During early trading
on Wednesday it looked like the Dollar Index might be about to make a
decisive break above 90, but the early strength couldn't be sustained
(see chart below). Interestingly, the Dollar began to weaken on
Wednesday as soon as the oil price started to come off and we've
noticed a similar interplay between the currency and oil markets at
other times over the past few months.
There is a school of thought that the dollar is benefiting from the
rise in the oil price because oil is traded in dollars so a higher oil
price creates more demand for dollars. This explanation doesn't ring
true, though, because the international trading of all commodities is
conducted in dollars and commodity bull markets tend to go hand-in-hand
with dollar bear markets (the opposite would be the case if higher
commodity prices provided a significant boost to dollar demand). A more
reasonable explanation is that interest rate differentials are the
dominant force in the currency market right now and that the dollar is
only appearing to benefit from a rising oil price due to the upward
pressure that the energy market is putting on short-term US interest
rates.

The Dollar Index
might spend some more time consolidating between 89 and 90, but we
expect that it will eventually break above 90 on its way to 100.
Update
on Stock Selections
 First
Majestic Resource (TSXV: FR) announced on Tuesday that its La Parrilla
silver mine in Mexico was now operating on a full-time basis following
a period during which the plant was overhauled, tested and upgraded. It
will be interesting to find out what the production rate and costs are
when the first full month of production is reported at the end of
August. First
Majestic Resource (TSXV: FR) announced on Tuesday that its La Parrilla
silver mine in Mexico was now operating on a full-time basis following
a period during which the plant was overhauled, tested and upgraded. It
will be interesting to find out what the production rate and costs are
when the first full month of production is reported at the end of
August.
So far, things are generally going according to plan with FR and we
expect that by the first half of next year the company will have at
least two silver mines in production (La Parrilla plus at least one of
the other past-producing mines recently acquired) producing a combined
total 2M-4M ounces of silver per year at a cash cost of around
US$3/ounce. Doing some quick calcs, if the company were able to achieve
a production rate of 3M ounces within 12 months then this would result
in cash-flow of around US$10.5M per year assuming the aforementioned
cash cost and a silver price of US$6.50/ounce; meaning that if the
stock traded at only 5-times cash-flow the stock price would be around
C$3.00.
Further to the above, we think FR has a very attractive risk/reward at
its current price of around C$1.64 because the stock provides good
leverage to the silver price (we are very bullish on silver taking a
1-2 year view), but substantial strength in the silver price should NOT
be required in order to achieve a high return from this investment.
By the way, in addition to being a cash-flow play FR also offers some
blue-sky exploration potential due to its Niko silver project. The
first drilling results from Niko are expected to be released next month.
 Afrikander Lease (AFKDY.PK) now has financing in place to see it through the coming 12 months (refer to http://www.sharenet.co.za/v3/sens_display.php?tdate=20040802120501&seq=1165 for details). Afrikander Lease (AFKDY.PK) now has financing in place to see it through the coming 12 months (refer to http://www.sharenet.co.za/v3/sens_display.php?tdate=20040802120501&seq=1165 for details).
The financing came at a hefty price in that it will result in a 50%
increase in the Aflease share count, but large-scale dilution of
existing shareholders was always going to be unavoidable due to the
company's precarious financial position. The important thing is that
Aflease's ability to stay in business over the coming 12 months is no
longer in question, meaning that its management can now focus on
generating value for shareholders from its stable of gold and uranium
projects. There is, in particular, the potential to realise enormous
value from the company's uranium assets.
 We aren't aware of any new developments that would explain it, but the
Saskatchewan Wheat Pool (TSX: SWP.B) stock price has been very strong
of late and broke out to the upside on Wednesday. If it can now hold in
the mid-40s during any near-term pullback then a move up to the
0.60-0.70 range would become a likely prospect.
Chart Sources
Charts appearing in today's commentary
are courtesy of:
http://stockcharts.com/index.html
http://www.futuresource.com/
http://www.decisionpoint.com/

|

