|
- 04 September, 2002
Secrets
of Professional Stock Market Speculation
One of the best books we've ever read
on stock market speculation was actually written about betting on horse
races. The book is "Secrets of Professional Turf Betting" by Robert Bacon.
It has been out of print for decades, but used copies can be obtained via
www.barnesandnoble.com.
Most people who bet on horse races
not only lose money, they lose much more money than they should lose based
on chance alone. What this means is that someone making purely random bets
on horses, or an untrained chimpanzee betting on horses, will, over a long
period of time, lose the track's 'take'. The 'take' is a fixed percentage,
usually in the 10%-20% range, that is extracted by the track (or jockey
club) out of the total amount of money bet on each race. The remaining
80%-90% is paid out to the winning bettors. In other words, if the track's
take is, say, 15%, then someone who selects horses based on random guesses
alone would, over a long period of time, be expected to lose an average
of 15% of the amount of money they bet each race day. However, the average
member of the betting public actually loses 33%-100% of the money they
outlay over the course of each racing day. It is almost as if they are
trying to lose!
While the vast majority of people lose
money at the races, some betting professionals consistently win. These
professional bettors generally do not have inside information or any resources
that are not readily available to members of the public. Nor is it usual
for them to be highly educated. So, how do they win? Since the public is
usually so wrong that it manages to lose far more money than it should,
it stands to reason that those who are able to consistently win do the
opposite of what the public does. As Robert Bacon puts it, "These professionals
win because they know the "inside" principle of beating the races, the
same principle that must be used to beat any speculative game or business
from which a legal 'take', house percentage, or brokerage fee is extracted.
That principle is: 'Copper' [bet against] the public's ideas...at all times!"
This principle certainly applies in
the stock market and is the reason we spend a lot of time analysing sentiment
indicators. If our analysis of sentiment indicators is 'on the mark' then
we will know what the collective mind of the public is thinking and can,
at the appropriate time, do the opposite. There is, of course, added complexity
in the stock market, or any financial market for that matter, since there
isn't a fixed pool of money that is distributed at fixed points in time
based on a set of clearly-defined rules. There is, therefore, a critical
timing element in the financial markets that is not present when betting
on horses (as the speculators who 'shorted' absurdly-priced internet stocks
during 1998 and 1999 discovered to their detriment).
In horse racing, betting against the
public involves the identification of "overlays". These are situations
where the odds assigned by the public (the odds at which a horse runs are
determined by the amount of money bet on that horse relative to the amount
of money bet on the other horses in the race) are longer than what the
odds should be. In other words, where the risk/reward ratio is in favour
of the bettor. For example, if a professional determines that the correct
odds for a particular horse are 2:1 whereas the public's betting puts the
horse at 10:1, then the professional has identified an "overlay" and may
decide to bet on that horse. If the professional determines the correct
odds to be 2:1 and the horse is quoted at 2:1 then the professional would
certainly not bet on that horse because, in such a case, the likely upside
and the likely downside are the same.
This leads us to another important
difference between the consistent losers (the public) and the consistent
winners (the professionals). Most race-going members of the general public
will bet on every race, whereas the professionals will only bet on those
races in which they have identified an attractive overlay. This might result
in the professional only betting on 2 or 3 races during a 10-race day.
If there are no attractive overlays in any of the races then he/she will
place no bets on that day.
The principle of only putting money
at risk in cases where there is an attractive overlay applies perfectly
to stock market speculation. An "overlay" in the stock market would, for
example, occur if the stock of a company is dramatically under-valued based
on the cash that it is currently generating or is likely to generate in
the future (the market value assigned by the public is low compared to
the company's intrinsic value). In such a situation a long-term speculator
(also known as a 'value investor') such as Warren Buffett might decide
to buy the stock. He does so because he knows that the stock price will
eventually return to its intrinsic value and he doesn't really mind how
long he has to wait for this to happen. For a short-term speculator a suitable
overlay might occur, for example, as a result of a period of panic selling
that sets the stage for a sharp rebound. Whether you are a long-term speculator
(investor) or a short-term speculator (trader), it is important not to
act unless you can identify an attractive overlay, that is, unless the
risk/reward is heavily in your favour. This means there will always be
periods, sometimes lengthy periods, when you should do nothing.
Another factor contributing to the
public's losses in the game of horse racing, and in all speculative endeavours,
is something called "switches". According to Robert Bacon it's not the
races that beat the amateurs, it's the switches. Whereas the professionals
develop a plan and stick to the plan the amateurs are continually changing
(switching) such things as the types of bets they make, the amount they
bet on each race, and the way they select horses. For example, an amateur
might try Method A for a while and when it doesn't appear to be working
switch to Method B. As soon as he switches to Method B, Method A starts
to win. Not wanting to make the same mistake again he decides to stick
with Method B, but Method A continues to win and Method B keeps losing.
After a while he can't stand it any longer so he switches back to Method
A, just before Method B hits a winning streak.
Most speculators in the financial markets
will have experienced the frustration wrought by switches, that is, they
will at some point have been coaxed by a market to switch strategies at
exactly the wrong time. One difference between the winners and the losers
is that the winners have figured out a way to avoid the switches. An important
part of this 'avoidance' is to only ever speculate in those instances when
you have identified, via a thoroughly-tested method, an attractive overlay.
From the perspective of a stock market
speculator the most important chapter in Robert Bacon's book is the one
that deals with the "principle of ever-changing cycles". We will discuss
this principle in the next Weekly Update.
The US
Stock Market
The September-11 Effect
Next week is the anniversary of the
Sep-11 terrorist attacks and the following week is the anniversary of the
waterfall decline in the US stock market that occurred in response to the
events of Sep-11. It is possible that nervous anticipation associated with
these anniversaries will keep the stock indices under pressure for the
next 1-2 weeks. However, markets seldom do what most people are expecting
them to do or are worried they might do. In particular, anniversaries of
major market declines often cause considerable trepidation as they approach
but just as often turn out to be 'bear traps'. This is especially true
on the first anniversary of a terrible event when the devastation of the
previous year is still fresh in the minds of most market participants.
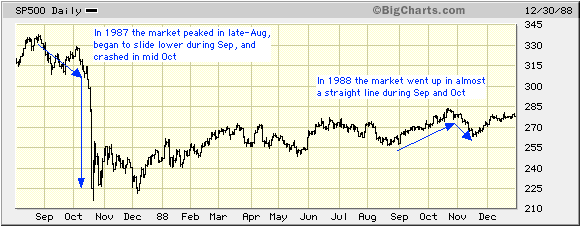
A good example of how markets often
respond to 'anniversary angst' occurred in 1988, 12 months after the stock
market crash. In 1987 the market peaked in August, began to decline during
September, then crashed in mid October. In 1988 there was a lot of anxiety
as the months of September and October approached. The huge losses suffered
the year before were still at the forefront of most traders' minds and
many were fearful that the market would crash again. However, during September
and October of 1988 the market moved higher in almost straight-line fashion.
In fact, a significant pullback did not occur until November when the danger
was perceived to have passed. The below chart of the S&P500 Index shows
what happened between August of 1987 and December of 1988.
The impending September-11 anniversary
might turn out to be a similar bear trap, with the decline that so many
people are worried about not starting until the danger is perceived to
have passed. With the market having just reached an oversold extreme, no
doubt partly due to nervousness associated with the Sep-11 anniversary,
this appears likely. It also meshes with our forecast for another rally
prior to the start of the bear-market's next downward surge.
Current Market Situation
From the e-mail alert sent to subscribers
prior to the start of trading on Wednesday: "With the market having
moved from being 'heavily overbought' to 'heavily oversold' we are now
at a point where either an upward reversal occurs or the market completely
falls to pieces and collapses below the July lows. We expect the former,
although we certainly wouldn't be taking any profits on put option positions
at this time. With or without a rebound to new recovery highs over the
next few weeks there is a good chance that the stock indices will trade
well below their current levels before the end of this year."
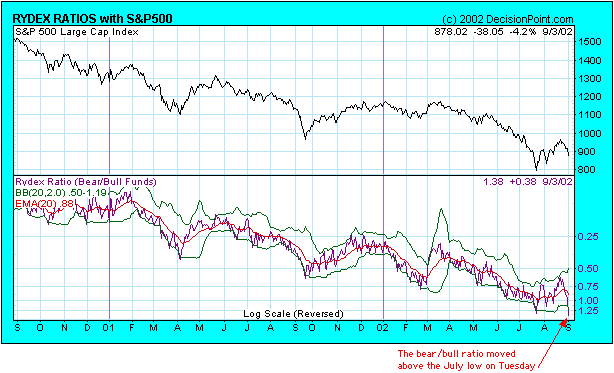
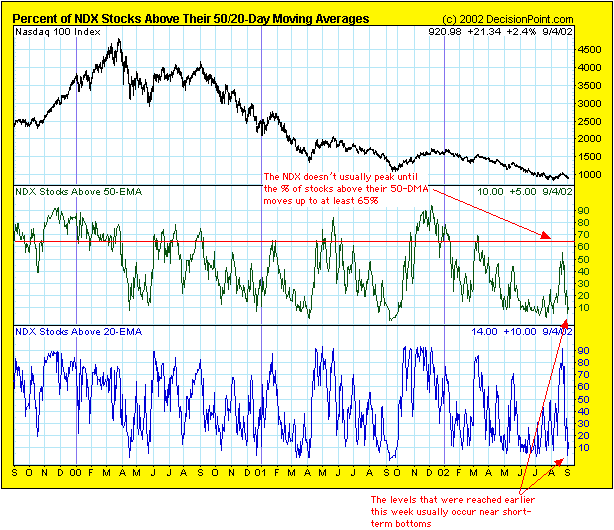
Below are two charts that illustrate
what we mean when we say the market had become "heavily oversold". The
first chart shows the amount of money in Rydex bear funds relative to the
amount of money in Rydex bull funds. Notice that the bear/bull ratio had,
as at the close of trading on Tuesday, moved higher than where it was in
late-July (shown as a new low on the chart since the scale is reversed).
This indicator suggests that people were more bearish early this week than
they were when the stock indices were bottoming in July. The second chart
shows the percentage of NASDAQ100 stocks that are trading above their 50-day
moving-averages and the percentage that are trading above their 20-day
moving-averages. As at the close of trading on Tuesday these percentages
had dropped to levels typically associated with short-term lows.
Although short-term sentiment indicators
just hit levels that reflect widespread fearfulness, there are very few
long-term bears. As discussed in last week's Interim Update the vast majority
of people remain very bullish as far as the long-term prospects for US
stocks and the US economy are concerned. Wall St strategists and analysts,
as a group, have also remained steadfastly bullish in the face of the relentless
downtrend. This bullishness in the face of horrible price action is especially
evident amongst the analysts at the major Wall St firms who follow the
semiconductor sector. The stocks in this sector have been slaughtered over
the past 12 months, yet during this period not one of the Wall St analysts
was officially bearish on the sector. The Semiconductor Index dropped to
a new multi-year low on Wednesday before rebounding, but there are still
no bears amongst this group of analysts. Not one. When the ultimate bottom
is reached they will all be bearish.
The market rallied on Wednesday as
it should have done following the panic selling that occurred on Tuesday.
It would, however, have been more bullish if the market had dropped sharply
on Wednesday morning prior to rallying. As it turned out, Wednesday's action
was indecisive and left open the possibility that the recent lows will
be breached before a multi-week rally begins.
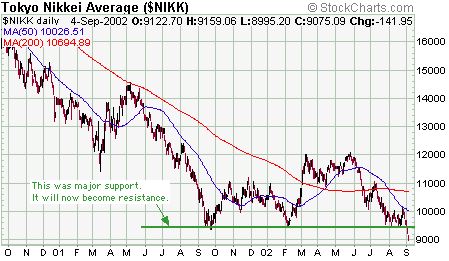
The Nikkei
Up until this week the Japanese Nikkei
Index had remained above last September's low, but earlier this week it
broke decisively below major support defined by the September-2001, February-2002
and August-2002 lows (see chart below). This prior support will now become
resistance.
The US and Japanese stock markets have
been moving with each other since the beginning of last year with the Japanese
market usually leading at important turning points. The Nikkei's breakdown
therefore provides further evidence that the July lows in the US stock
indices were not long-term or even intermediate-term bottoms (as if we
needed any more evidence!).
Following a breakout a market will
often move back to 'test' the breakout. As such, a bounce in the Nikkei
to around the 9500 level some time during the next few weeks would not
be a surprise.
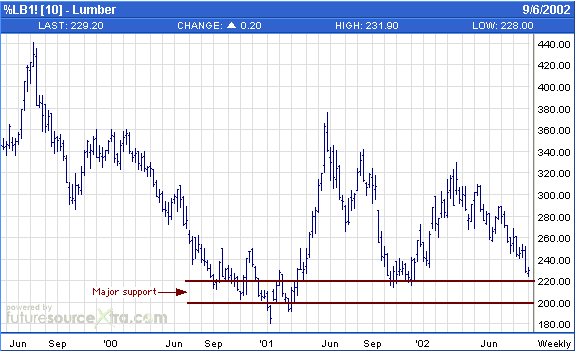
Commodities
Commodity prices in general have been
strong over the past few months. However, the price of one of the most
important and economically-sensitive commodities - lumber - has recently
been very weak. In fact, lumber futures have fallen by around 30% since
March.
Below is a weekly chart of lumber futures.
The behaviour of the lumber price over the next several weeks will be an
important 'tell' regarding the economy and the demand for other economically-sensitive
commodities such as copper. In particular, a break below support in the
$200-$220 range would be a very bearish development.
Gold and
the Dollar
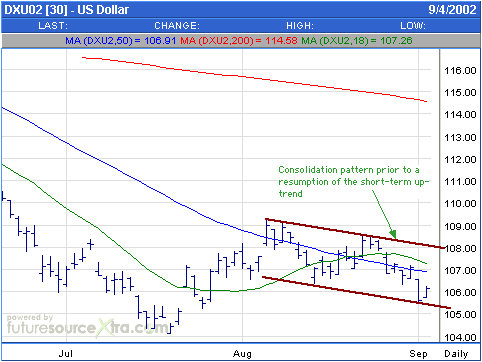
Current Market Situation
Regardless of what the sentiment indicators
were saying we wouldn't be giving the benefit of the doubt to the stock-market
bulls in the short-term if the US Dollar's price action did not have short-term
bullish connotations. After all, the stock market is experiencing its most
severe bear market since the 1930s and we don't have records from the 1930s
to show us just how 'oversold' a market can become in such circumstances.
When there are no historical benchmarks to go by (no relevant ones, anyway,
because a parallel to the current situation has never occurred during a
period when sentiment was objectively measured) the risks are much greater
or, at least, less quantifiable. At the moment, however, the US$ appears
to be consolidating ahead of another push higher (see the daily chart of
the September Dollar Index below). A daily close above 108.50 would suggest
that the Dollar Index was on its way to our 111-112 target for this counter-trend
rally. Note - a daily close below 105 would negate the short-term bullish
argument.
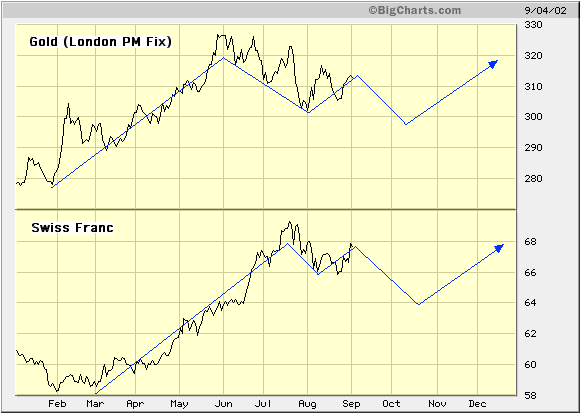
Below is a chart comparing the gold
price and the Swiss Franc. Our view is that the rebounds in both the SF
and gold that began in early August are counter-trend moves within on-going
corrections. This is the interpretation that makes the most sense to us
based on price action, inter-market relationships and sentiment indicators.
Note that the gold price has been leading the SF since the beginning of
this year, so we shouldn't be surprised if gold bottoms and begins heading
higher before the SF completes its correction.
Below is a 6-month chart of the Amex
Gold BUGS Index (HUI). Anyone who didn't take profits on gold stocks during
May/June and subsequently regretted it has just been given another good
opportunity to do so. There is a reasonable chance that the gold price
and the HUI will spike a bit higher in the short-term, but the rebounds
from the July/August lows are now 'long in the tooth'. We expect that most
of the major gold stocks will hold above their July lows during any pullback
over the next few weeks.
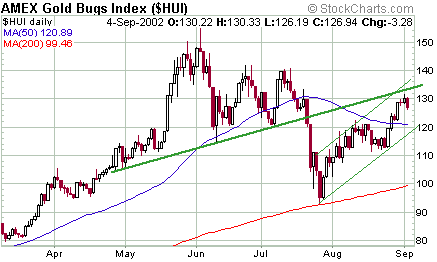
Chart Sources
Charts used in today's commentary were
taken from the following web sites:
http://stockcharts.com/index.html
http://www.decisionpoint.com/
http://bigcharts.marketwatch.com/

|
