|
- Interim Update 4th September 2013
Copyright
Reminder
The commentaries that appear at TSI
may not be distributed, in full or in part, without our written permission.
In particular, please note that the posting of extracts from TSI commentaries
at other web sites or providing links to TSI commentaries at other web
sites (for example, at discussion boards) without our written permission
is prohibited.
We reserve the right to immediately
terminate the subscription of any TSI subscriber who distributes the TSI
commentaries without our written permission.
US
Manufacturing Strength
The monthly ISM (Institute of Supply Management) numbers
reported on Tuesday 3rd September (for the month of August) revealed
that the strong numbers reported a month earlier were not a fluke.
The US manufacturing sector has clearly strengthened of late.
The most important sign of strength is the sharp up-move in the ISM
New Orders Index to its highest level since April of 2011.
Perspective is provided by the following chart.
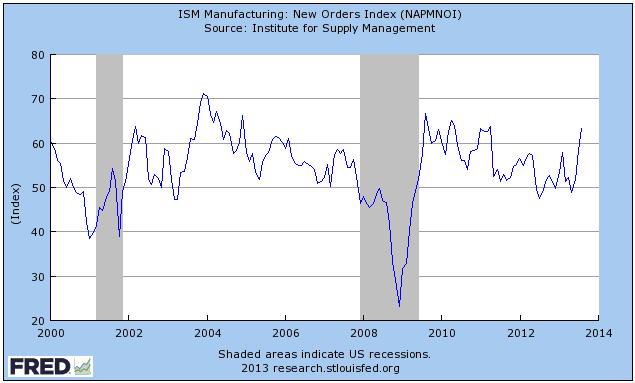
We consider the monthly ISM report on the US manufacturing sector to
be the best coincident indicator of US economic performance. It is a
good indicator of how the US economy is performing in the present.
It does not, however, tell us much about the economy's likely future
performance.
On Friday 6th September we will get the next monthly US employment
report. The employment report is a backward-looking economic
indicator of dubious quality, but it often has a greater effect on
short-term market sentiment than the far more useful reports from
the ISM. This is because the Fed, for political reasons, focuses on
the employment data, and monetary policy is currently the most
important single influence on the major financial markets. So, while
a weak employment report on Friday would in no way negate the
message of Tuesday's strong ISM report, the financial markets would
probably react as if it did.
The Stock Market
The US
The lead article in the latest edition of Barrons Magazine is headed "Fall
Forecast: Sunny". The sub-heading is: "With the economy growing and earnings on
the rise, stocks could head higher in coming months. Market strategists like
technology and industrials, but not utilities. Who's afraid of the Fed?" The
article was based on interviews with ten Wall St strategists.
The equity strategists interviewed by Barrons were mostly bullish. Furthermore,
even the bears weren't particularly bearish. The overall impression was of
complacency among the strategists. Not unexpectedly, this impression is
consistent with other indicators of stock market sentiment. It's not so much
that there is widespread exuberance about the stock market's prospects, just a
general feeling that nothing really bad is going to happen anytime soon.
While a general feeling that nothing bad is going to happen is a necessary
pre-condition for a large stock market decline, it doesn't ensure that a large
stock market decline will begin in the near future. It just adds to the downside
risk. The market's high average valuation also adds to the risk that a large
decline will soon begin. A third risk is that mid-term and long-term interest
rates have risen markedly over the past few months, although we expect that this
risk will soon abate courtesy of a rebound by an extremely 'oversold' bond
market.
A caveat is that valuation is often not an important driver of short-term
performance and the market's sentiment problem could be eradicated by the senior
stock indices falling an additional 5%-10% over the next several weeks. Our
outlook, therefore, is that the US stock market is either in the midst of the
first decline in a new cyclical bear or part of the way through a long-overdue
downward correction. Either way, the senior US stock indices will probably trade
below their August lows within the next six weeks.
Although it is irrelevant, the debt-limit debate in the US parliament could end
up being viewed as the catalyst for significant stock market weakness during the
second half of September and the first half of October (the US federal
government has reached its current debt limit and will apparently, unless the
limit is raised, run out of money by mid-October). Just to be clear: the level
of the government's debt is important; the debt limit isn't. The debt limit is
just an arbitrary number that gets hit and then raised every couple of years,
with the hike in the limit always being accompanied by heated debate between
both wings of the 'Repocrat' party. Both wings (the Democrats and the
Republicans) always pretend to be fiscally prudent and driven by a desire to
rein-in the government's deficit-spending, but neither party is ever willing to
reduce the flow of money to its favoured special-interest groups. The cumulative
total of the government's borrowings therefore continues along a steep upward
path regardless of which political wing holds the upper hand, but whenever the
debt limit is reached we get treated to a media circus and a flood of
propaganda.
Turning to the charts, we again feature the stark difference in the recent
performances of the NASDAQ100 Index (NDX) and the Dow Industrials Index (Dow).
As illustrated by the first of the following daily charts, the downward
correction in the NDX has been very minor to date. In fact, the NDX has just
moved back to near its high for the year and looks set to make a new high within
the next week or so.
But as illustrated by the second of the following daily charts, the Dow is not
only well below its high for the year, it is also well below its 50-day MA.
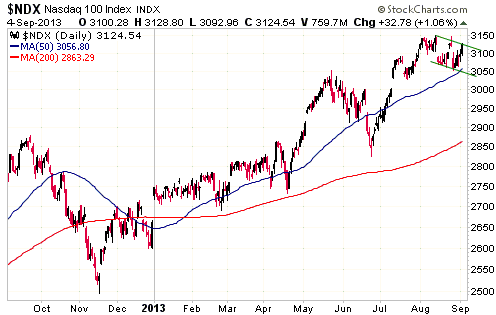
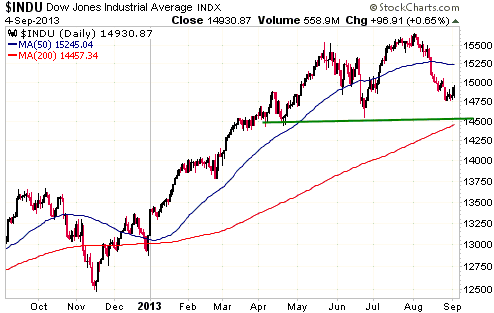
For both of the above-mentioned stock indices, key support as far as the
intermediate-term trend is concerned is defined by the June low.
The Dow will obviously hit/breech intermediate-term support prior to the NDX.
Looking from a different angle, if the Dow manages to hold above its June low
during any additional price weakness over the coming month or so, it will mean
that the market's intermediate-term advance is probably not over.
Gold and the Dollar
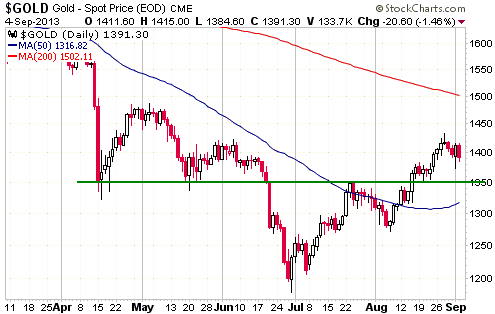
Gold
The T-Bond and the Yen, two of the most popular safe havens, fell sharply on
Tuesday in reaction to the combination of a stock market rebound and the US
economic strength indicated by the ISM report, whereas gold, the ultimate safe
haven, ended the session with a gain of $15. More significantly, gold ended
Tuesday's session almost $40 above its intra-day low. This was a surprisingly
good performance considering the news backdrop, but the surprisingly good
performance on Tuesday in the face of gold-bearish news was offset by weakness
the next day in the face of no news. The net result of the back-and-forth price
action was insignificant.
At this stage there is no basis for making an educated guess as to whether the
decline from last week's Syria-inspired spike is a minor interruption to a
short-term upward trend or the start of a new short-term downward trend. Support
at $1350 is the demarcation level, in that a minor interruption to a continuing
short-term upward trend should do no worse than take the price down to the
$1350s.
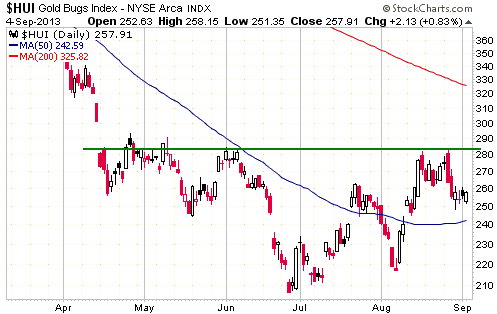
Gold Stocks
The gold sector of the stock market, as represented by the HUI, didn't react to
either the bullish performance by gold bullion on Tuesday or the $20 decline in
the gold price on Wednesday. The price action during the first half of this week
therefore provided no new information.
In the latest Weekly Update we described the two most likely short-term HUI
scenarios. For the more bullish of these scenarios to remain in play the HUI
must soon move above resistance in the low-280s. The alternative is a downward
trend to an October-November low.
As expected, strikes have hit the South African gold-mining industry this week,
but despite the claims of union leaders the strikes will probably not last long.
This is evidenced by the fact that the National Union of Mineworkers (NUM), the
union that represents about two-thirds of workers in SA's gold-mining industry,
has just dropped its wage-increase demand from 60% to 10%, and that a wage
increase of 7.5%-8.0% has already been agreed with two small gold producers. The
major producers have offered a 6.5% wage increase.
This latest round of labour unrest will probably be settled within the next two
weeks, but more problems lie ahead.
Currency Market Update
The Dollar Index has rebounded over the past 1-2 weeks, but it hasn't yet done
anything to signal that a multi-month bottom is in place. At this stage it
hasn't even been able to break solidly above its 50-day MA.
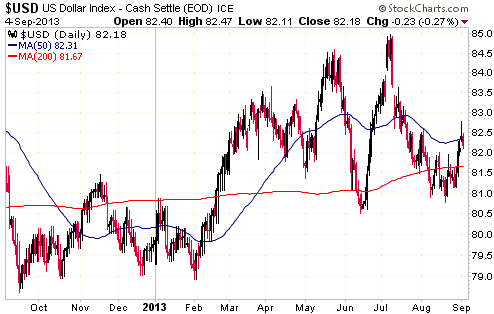
We are questioning our intermediate-term bullish assessment for the Dollar
Index. This is because the Dollar Index has essentially gone nowhere over the
past 6 months (it's at the same level now as it was in early March) and we are
finding it increasingly difficult to come up with good reasons to anticipate a
substantial upward move within the next several months.
We will re-visit the US dollar's intermediate-term outlook in the coming Weekly
Update.
Update
on Stock Selections
Notes: 1) To review the complete list of current TSI stock selections, logon at
http://www.speculative-investor.com/new/market_logon.asp
and then click on "Stock Selections" in the menu. When at the Stock
Selections page, click on a stock's symbol to bring-up an archive of
our comments on the stock in question. 2) The Small Stock Watch List is
located at http://www.speculative-investor.com/new/smallstockwatch.html
Chart Sources
Charts appearing in today's commentary
are courtesy of:
http://stockcharts.com/index.html
http://research.stlouisfed.org/

|
