![]()
![]()
![]()
![]()
- Interim Update 4th October 2017
Copyright
Reminder
The commentaries that appear at TSI
may not be distributed, in full or in part, without our written permission.
In particular, please note that the posting of extracts from TSI commentaries
at other web sites or providing links to TSI commentaries at other web
sites (for example, at discussion boards) without our written permission
is prohibited.
We reserve the right to immediately
terminate the subscription of any TSI subscriber who distributes the TSI
commentaries without our written permission.
US Recession Watch
We pay close attention to three
leading indicators of US recession: Real Gross Private Domestic Investment
(RGPDI), the US yield curve and the ISM Manufacturing New Orders Index
(NOI). The latest iteration of the last of these indicators was reported
on Monday 2nd October.
The ISM NOI for September came in at 64.6.
This is very close to the top of its 10-year range and obviously a long
way above the level it would have to fall below (the red line on the
following chart) to warn of a recession.
With none of the leading indicators we care about currently warning of
recession and with the NOI having just risen to the top of its 10-year
range, the probability of a US recession beginning in 2017 is now
approximately zero. Given the tightening of monetary conditions it is
possible that a recession will begin as soon as the first quarter of 2018,
but it's more likely that there will be no recession until Q2-2018 or
later.
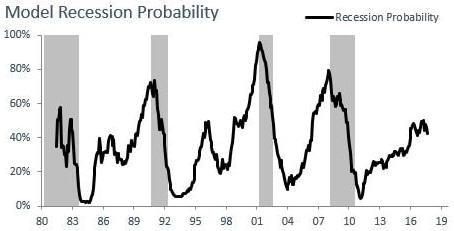
On a related matter, we mentioned a month ago that we had
discovered the web site
https://www.recessionprotect.com/. This site contains some economic
and stock-market models, one of which is the Recession Probability Model
depicted below. While this model's current reading of 43% suggests that
caution is warranted, it is well below the 70% level that was reached
prior to the starts of previous recessions.
The subscriber information at RecessionProtect.com gets updated at the
end of each quarter. An annual subscription costs $99, but the proprietor
of the site (Damon Callaghan, email damon.callaghan@gmail.com) is offering
TSI subscribers a one-year free trial.
To get the free trial,
first submit your name and contact information at
https://www.recessionprotect.com/store/p2/membership. Then in the
"Payment Info" section click on "Add coupon code", enter TSI100 as the
code and click "Next". This gives you a 12-month subscription with no
requirement to make any current payment and no obligation to make any
future payment.
We have no affiliation with RecessionProtect.com
and at this stage are unsure of its value, but it could be a useful tool
and thanks to the free trial offer it costs nothing to find out.
Could the next US
equity bear market occur in the absence of a recession?
The answer to the above question
is yes, it could, but it almost certainly won't. Both the historical
record and logic indicate that the next bear market in US equities will
almost certainly be accompanied by an economic recession.
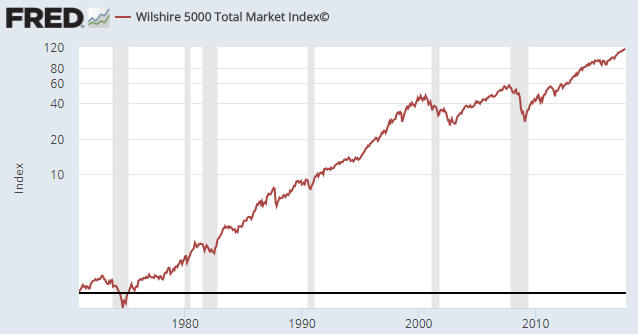
With
regard to the historical record, the following chart shows the
Wilshire5000 Total Market Index and the periods during which the US
economy was officially in recession (the shaded areas are the recession
periods). If we define a cyclical bear market as a downward trend lasting
at least 18 months and resulting in a peak-to-trough decline of more than
20% then there were four cyclical bear markets during the period covered
by the chart (1973-1974, 1980-1982, 2000-2002 and 2007-2009) and each of
these bearish cycles coincided with a recession. There were, however, two
recessions that didn't coincide with an equity bear market.
The
historical record therefore suggests that there could be a recession
without an equity bear market but not an equity bear market without a
recession.
With regard to logic, the monetary stimulus of the past several years
did a lot more to boost the stock market than the economy. The economy has
plodded forward at a snail's pace while the stock market has soared.
Ironically, this makes the economy less vulnerable than the stock market
to the removal of 'monetary support' and makes it very unlikely that the
economy will fare worse than the stock market at the conclusion of the
current cycle. Consequently, if there's a recession then there will almost
certainly be a bear market.
Also, even though the financial markets
have been distorted to a greater extent than the real economy by the
monetary machinations of the past several years, it's not realistic to
expect that the sort of general decline in leverage and pullback in
business spending that would be prompted by an equity bear market could
occur without the economy entering recession territory.
The bottom
line is that the next equity bear market and the next recession will go
hand-in-hand.
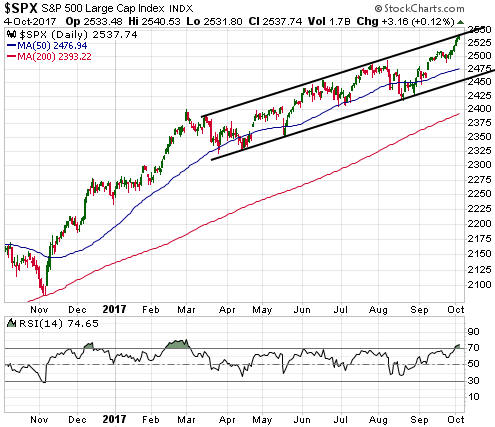
The Stock Market
The S&P500 Index (SPX) gained
enough additional ground over the first three days of this week to reach
the top of its 6-month price channel. Also, the RSI included at the bottom
of the following chart indicates that it is 'overbought'.
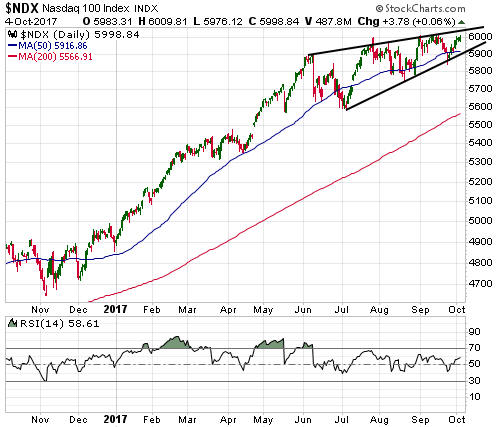
The NASDAQ100 Index (NDX) has been weaker than the SPX of late and is
yet to break above its July high or become 'overbought'. However, it is
only about 0.5% from the top of the wedge pattern that it has traced out
since June.
As recently as a month ago the Russell2000 SmallCap Index (RUT) looked
like it was in the process of completing a major topping pattern, but it
then moved upward into all-time high territory in a virtual straight line.
To say that it is now 'overbought' would be an understatement given that
on Tuesday of this week its daily RSI(14) hit a 20-year high.
The above charts suggest that the US stock market is close to at least
a multi-week top in nominal terms. The chart displayed below suggests that
it is in a similar position in gold terms. At least, the following chart's
message is that the SPX/gold ratio is about to either reverse downward
from near 2.0 for the fourth time in two years or achieve a very important
upside breakout.
Whether the SPX/gold ratio reverses course without making significant
additional headway or breaks above its highs of the past 2 years will have
important implications for both the stock market and the gold market. In
particular, a solid break by the SPX/gold ratio to a new multi-year high
would eliminate the possibility that a cyclical gold bull market began in
December-2015.
Gold and the Dollar
Gold
We
think that the US$ gold price is close to a multi-week low, but that there
could be a final downward spike within the coming few days that pushes
gold's daily RSI (refer to the bottom section of the following chart) into
'oversold' territory (<30) prior to such a low being reached. The 200-day
MA near $1250 presents a realistic target for a final downward spike.
Perhaps the US monthly employment report on Friday 6th October will be
the catalyst for a trend-ending downward spike in the gold price. We can't
see a good reason for there to be a significant market reaction to
Friday's employment news, but it is often hard for us to predict how other
traders will react to news that should be unimportant.
The monthly
employment numbers are only ever important to the extent that they
influence the actions of the Fed and it's very unlikely that the numbers
to be reported this Friday will have any influence on the Fed. The reason
is that due to weather-related effects (the hurricanes) the reported
jobs-growth number is widely expected to be low, which means that a low
number will be put down to the hurricanes and will not reduce the
probability of a Fed rate hike in December. On the other hand, the futures
markets have almost fully discounted a Fed rate hike in December, so there
is very little scope for a strong number to increase the perceived
probability of such an outcome.
That is, neither a weak nor a
strong employment report on 6th October should have a significant effect
on what the Fed does over the coming few months, but that doesn't
guarantee that it won't cause some near-term gold-market volatility.
Based on the deterioration of gold's true fundamentals and the
non-supportive sentiment backdrop, at this stage we expect that gold's
rebound from an early-October low will end at a lower high (that is, below
$1362) and be followed by a decline to a lower low (that is, below
whatever low is put in place this week or next).
Gold
Stocks
Over the first three days of this week the HUI
survived another test of its 200-day MA and then moved up to its 50-day
MA. This is neutral price action.
The HUI is in a similar position
to gold. It is probably close to a multi-week low, but there could be a
final downward spike prior to such a low being reached. We think that if
there is a final downward spike in the HUI it will end at 180-185.
We would be remiss if we didn't point out that the gold-mining indices
have shown strength relative to gold bullion over the past few days. As
illustrated below, the relative strength was sufficient to push the
HUI/gold ratio above its 40-day and 150-day moving averages.
The
HUI/gold ratio has broken above its 40-day and 150-day MAs on three
previous occasions since the beginning of the year, but this is the first
time it has happened with both the HUI and gold near multi-week price
lows. That the latest HUI/gold breakout has happened with the market
closer to 'oversold' than 'overbought' improves the chance of significant
follow-through to the upside.
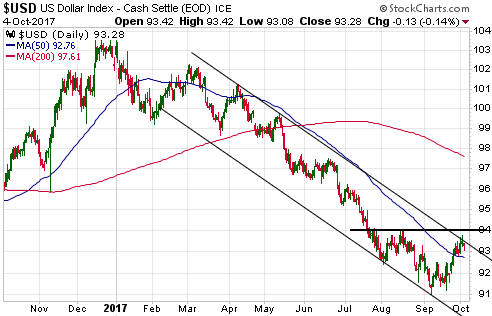
The Currency Market
The Dollar Index (DX) may
have completed the initial rebound from its September low, but just as
there could be a final downward spike in the gold market within the next
few days to set a multi-week price low there could be a final upward spike
in the Dollar Index to set a multi-week price high.
As illustrated
below, the DX has lateral resistance at 94. This resistance is a potential
target for a near-term upward spike. Alternatively, if it turns out that
the DX's initial rebound is already complete then the price action of the
past three days has defined the top of a channel that will be useful in
the future.
Updates on Stock Selections
Notes: 1) To review the complete list of current TSI stock selections, logon at
http://www.speculative-investor.com/new/market_logon.asp
and then click on "Stock Selections" in the menu. When at the Stock
Selections page, click on a stock's symbol to bring-up an archive of
our comments on the stock in question. 2) The Small Stock Watch List is
located at http://www.speculative-investor.com/new/smallstockwatch.html
Chart Sources
Charts appearing in today's commentary
are courtesy of:
http://stockcharts.com/index.html
http://research.stlouisfed.org/
![]()