|
- Interim Update 4th November 2009
Copyright
Reminder
The commentaries that appear at TSI
may not be distributed, in full or in part, without our written permission.
In particular, please note that the posting of extracts from TSI commentaries
at other web sites or providing links to TSI commentaries at other web
sites (for example, at discussion boards) without our written permission
is prohibited.
We reserve the right to immediately
terminate the subscription of any TSI subscriber who distributes the TSI
commentaries without our written permission.
Money, Credit, and Deflation
Frank Shostak, one of the most levelheaded contributors to the inflation-deflation debate, recently posted an article
that discusses the difference between money and credit and explains why
a decline in credit does not, in and of itself, imply or cause
deflation. Here is the article's conclusion:
"Contrary to popular
thinking, it is not a fall in credit as such that is the key to
deflation, but a fall specifically in credit created out of thin air.
It is this type of credit, which commercial banks have created through
fractional-reserve lending, that causes the decline in money supply,
i.e., deflation. A fall in normal credit (i.e., credit that has an
original lender) doesn't alter the money supply, and hence has nothing
to do with deflation.
Despite the likely
current fall in commercial-bank lending out of thin air, as long as the
rate of growth of the money supply remains positive, one should talk
about inflation rather than deflation.
However, as the pace of
monetary pumping by the US central bank is starting to fall sharply,
there is a growing likelihood that the fall in commercial-bank lending
out of thin air will cause actual deflation."
This meshes with a point we have made a number of times over the past
12 months, which is that a decline in the supply of credit is only
"deflationary" to the extent that it brings about a decline in the
supply of money. A related point is that if the total supply of money
is growing -- and especially if it is growing at an accelerating rate
-- then regardless of what is happening on the 'credit front' the
economy is experiencing inflation, not deflation.
We again emphasise that the main problem with monetary inflation isn't
that it causes the average price level to rise (although the "Consumer
Price Index" will eventually rise in response to a large increase in
the money supply); it's that it distorts relative prices, resulting in
mal-investment and an undeserving transfer of wealth.
Note the final sentence in Frank Shostak's article. Up until now the
Fed's monetary pumping has more than offset deflationary forces such as
the decline in "commercial-bank lending out of thin air", but if the
pace at which the Fed creates new money -- by, for example, monetising
government debt and mortgage-backed securities -- slows over the months
ahead, then the US economy could experience actual deflation.
Our view is that the Fed will re-accelerate its monetary pumping well
before the money-supply growth rate goes negative, with the Federal
Government providing whatever borrowing power is required. After all,
Bernanke is labouring under the misapprehension that a decline in the
money supply caused the Great Depression.
We would be wrong, though, to state that deflation is impossible. It's
not impossible, just very unlikely within the current
political/monetary framework.
The Stock Market
A Typical Recovery?
In his 2nd November Weekly Comment,
John Hussman writes that we currently face two data sets characterising
two very different possibilities for the true state of the world. In
Dr. Hussman's words:
"One possibility, which
is clearly the one that Wall Street has subscribed to, is that the
recent downturn was a standard, if somewhat more severe than normal,
post-war recession; that the market's recent strength is an indication
that it is looking forward to a full "V-shaped" recovery, and that the
positive print for third-quarter GDP is a signal that the recession is
officially over. Applying the post-war norms for stock market
performance following the end of a recession, the implications are for
further market strength and the elongation of the recent advance into a
multi-year bull market.
The alternate
possibility, which is the one that I personally subscribe to, is that
the recent downturn was the initial phase of a more prolonged
deleveraging cycle; that the advance we've observed in recent months
most likely represents mean-reversion -- qualitatively and
quantitatively similar to the large and often abruptly terminated
"clearing rallies" of past post-crash markets; that major credit losses
are continuing quietly but are going unreported thanks to changes in
accounting rules by the FASB this past spring, which allowed for
"substantial discretion" in accounting for loan losses and
deterioration in the value of securitized mortgages; that a huge
second-wave of mortgage losses can be expected from a reset schedule on
Alt-A and Option-ARMs that has just started (following a lull in the
reset schedule since March) and will continue into 2010 and 2011; that
intrinsic economic activity remains abysmal; that recent GDP growth is
an artifact of massive fiscal stimulus that is unlikely to have
sustained follow-through; and that recent market valuations are not
representative of those observed at the end of most post-war
recessions, but are instead similar to those observed at major market
peaks prior to the mid-1990's."
Like Dr. Hussman, we subscribe to the "alternate possibility". It is
very much a minority view, as evidenced by the generally high level of
optimism reflected over recent months by indicators of stock market
sentiment. Furthermore, the view is not only contrary to that of most
'run-of-the-mill' analysts, investors and commentators, it is also
contrary to that of a few 'top-notch' analysts and investors (including
James Grant, who expects the uncommonly sharp downturn of 2007-2008 to
be followed by an uncommonly sharp upturn, and Warren Buffett, who just
paid US$34B to buy a rail transportation company in what he describes
as a bullish bet on the US economy). However, we think it is by far the
most logical view, given that the economy is trying to recover from the
collapse of the world's greatest-ever credit bubble but is being
prevented from doing so by aggressive government intervention.
As we've been saying over the past year or so, the governments of today
are making the same mistakes that were made by the Hoover and Roosevelt
Administrations during the 1930s (propping up prices, transferring
wealth to failed businesses, increasing "regime uncertainty" via more
regulations and taxes, discouraging saving, ramping up government
spending, and trying to replace a private-sector credit bubble with a
government credit bubble), but on a much grander scale.
In the aftermath of a multi-generational credit bubble and with
governments seemingly making every conceivable error, how could we
possibly forecast a typical post-WWII recovery?
Current Market Situation
The following daily chart shows that the Dow Industrials Index has good
support at 8750-9000. In our opinion, this support defines the
short-term downside risk and is also a reasonable short-term target.

We continue to expect
that a short-term bottom will be in place by mid November, but this is
based on the assumption that the market will continue to work its way
downward in the interim. If, instead, the market rebounds over the
coming 1-2 weeks then either the short-term correction is going to last
longer than expected or the October peak was less significant than we
currently believe.
Gold and
the Dollar
Gold
Current Market Situation
As everyone is undoubtedly aware, it was announced on Tuesday that the
Indian Government bought 200 of the 403 tonnes of gold recently put up
for sale by the IMF. Neither 200 tonnes nor 403 tonnes are substantial
amounts in the context of the overall gold market (an average of about
650 tonnes of physical gold changes hands every day via the London
Bullion Market Association), but India's purchase was potentially
significant because it may be indicating that the "official sector" --
the current holder of about 30,000 tonnes of aboveground gold -- has
shifted from being a net seller to a net buyer of gold. That, we think,
goes a long way towards explaining this week's surge in the gold price.
The Fed's pledge to hold its targeted short-term interest rate at close
to zero for an extended period also helped.
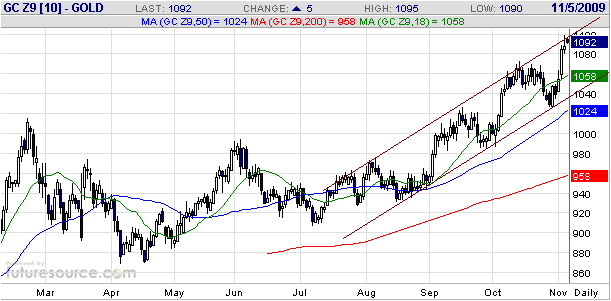
The gold price is now challenging the next psychological obstacle,
which is $1100. Also, it is near the top of what is now a well-defined
channel, meaning that it will soon have to experience another pullback
or that the slope of its upward trend will have to become steeper.
Our view is that a short-term top won't be in place before December.
Why? Because when gold makes a new high for the year during October the
rally almost always continues until at least December.
Gold is 'overbought'
by some measures, but you should ignore claims that there is a gold
bubble. Gold will almost certainly enter 'bubble territory' at some
point over the next several years, but at this stage of the bull market
we are yet to see the sort of upward acceleration in the gold price
that was seen during either the first half or the second half of the
1970s. Also, the gold price has not yet accelerated upward the way the
prices of many industrial commodities did at various times over the
past 4 years.
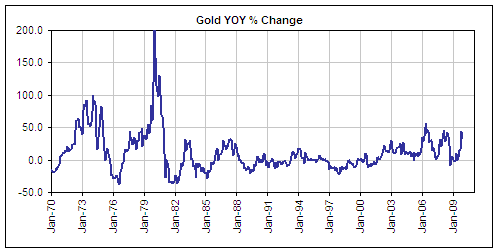
To further explain what we mean we have included, below, a monthly
chart showing the year-over-year (YOY) percentage change in the gold
price. The chart shows that gold's YOY % change peaked at 100% during
the first half of the 1970s and at 200% during the second half of the
1970s, but has not managed to exceed 45% over the past 2 years. Recall,
as well, that the oil price doubled during the final 12 months of its
multi-year run-up.
It will be reasonable
to start talking about a gold bubble if the gold price rockets up to
around $2000 within the next few months, but our view is that the gold
market won't enter bubble territory anytime soon. We think the gold
bull market has years to run, and that the next peak -- which is likely
to occur before year-end -- will be followed by another normal
(10%-20%) correction.
Gold versus Silver
Many people believe that silver offers very good value relative to gold
on the basis that the gold/silver is presently very high by historical
standards. In particular, an ultra-long-term (multi-century) view of
the ratio reveals that silver has tended to trade at around
one-fifteenth the price of gold (a gold/silver ratio of 15:1), compared
to its current level of around one-sixtieth (a gold/silver ratio of
60:1).
This line of thinking doesn't appeal to us. The fact is that long-term
relationships sometimes change, especially when the monetary system
undergoes dramatic change. The gold/silver ratio is not similar to a
stock market valuation such as a price/earnings ratio, where there will
always be good reason to expect an eventual return to the long-term
average regardless of what happens over shorter time periods.
If we focus on what has happened over the past 11 years we see that the
silver/gold ratio has generally trended with the US stock market (as
evidenced by the following chart), and that the current level of the
ratio is about right considering the current level of the S&P500
Index. Furthermore, the market action of the past 11 years suggests
that it only makes sense to be bullish on silver relative to gold at
this time if you also expect that the US stock market will maintain its
intermediate-term upward trend.

Gold Stocks
Current Market Situation
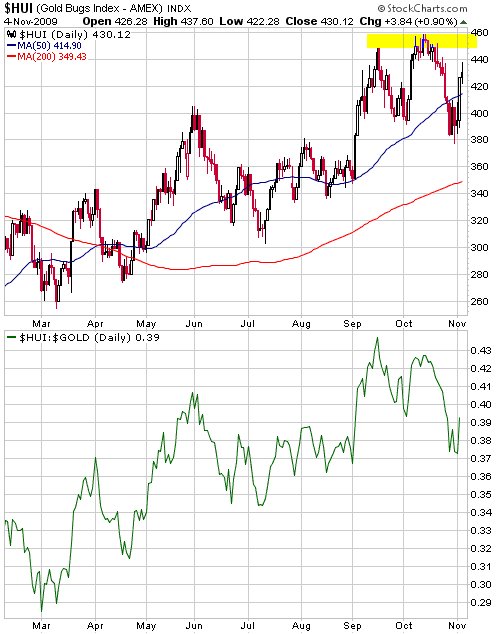
A chart comparing the HUI and the HUI/gold ratio is displayed below.
The chart shows that the HUI has substantial resistance at 450-460 and
that the HUI/gold ratio has been declining since mid-September.
In our opinion, the most likely near-term outcome is that the HUI will
test the aforementioned resistance within the next three weeks and then
resume its intermediate-term correction. The next most likely outcome
is that the HUI will make a new high for the year before the end of
this month, but the new high will only be marginal (no more than 5%
above the October high) and won't be confirmed by the HUI/gold ratio.
An intermediate-term correction would then begin. The third most likely
outcome is that the HUI has just commenced a new multi-month advance.
The third most likely outcome will shift to being the most likely
outcome if the HUI makes a new 52-week high after the first week of
December.
Suggested Actions
The actions that are appropriate for an investor at any time will be
determined, to a substantial degree, by his/her current positioning.
For example, an investor who is very overweight gold shares should
respond differently to the current market action than one who has
minimal exposure to this sector of the market. In particular, whereas
the investor with large exposure to gold shares should be looking for
opportunities to lock-in gains and generally mitigate the impact of the
next downward correction, the investor with very little current
exposure and a reasonably high tolerance for risk should still be
looking for opportunities to buy under-valued junior gold stocks. The
following suggested actions apply to the former (someone with large
exposure).
1. Use strength over the next three weeks to lighten-up on gold/silver
stocks that have made very sharp upward moves or that you don't plan to
hold over the long-term.
2. Partially hedge your exposure to the gold/silver sector by scaling
into SLV and/or GDX put options that have at least three months of time
before expiry.
Remember that risk management always costs you money, except when it
turns out that you need it (in which case it pays large dividends).
Unfortunately, you never know in advance exactly when you are going to
need it, and by the time you do know for sure it will usually be too
late to do anything about it. For example, you can't wait until your
house begins to burn down before buying fire insurance. The point is
that you have to do the risk management before you can be certain that
you will actually need it.
Currency Market Update
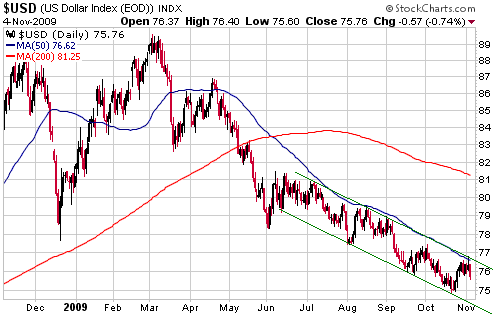
The following chart shows that the Dollar Index spiked up to its
channel top and its 50-day moving average on Tuesday, and then reversed
lower. From our perspective, therefore, the situation is unchanged. We
think the Dollar Index is close to a bottom, but there is presently no
meaningful price-related evidence that a bottom is in place.
Some market
participants/observers are always bearish on the US$, whereas others
seem to be bullish all the time. Both the always-bearish and
always-bullish camps lack objectivity. Of those who maintain an open
mind, most appear to be anticipating a significant US$ rebound. This
suggests that the outcome that would leave the greatest number of
objective analysts leaning the wrong way would be substantial
additional weakness in the US$.
We are not stepping away from our view that the Dollar Index is close
to an intermediate-term bottom. We are saying that sentiment is
probably not as lopsidedly anti-US$ (that is, supportive of a US$
rebound) as many 'contrarians' believe.
Update
on Stock Selections
(Note: To review the complete list of current TSI stock selections, logon at http://www.speculative-investor.com/new/market_logon.asp
and then click on "Stock Selections" in the menu. When at the Stock
Selections page, click on a stock's symbol to bring-up an archive of our comments on the stock in question)
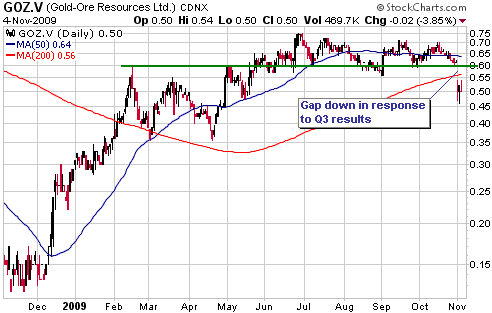
 Gold-Ore Resources (TSXV: GOZ). Shares: 82M issued, 89M fully diluted. Recent price: C$0.50 Gold-Ore Resources (TSXV: GOZ). Shares: 82M issued, 89M fully diluted. Recent price: C$0.50
The stock price of Gold-Ore Resources, a small-scale gold producer
based in Sweden, was hit hard on Monday in reaction to the quarterly
production and financial results reported after the close of trading
last Friday. The magnitude of the sell-off surprised us, because we
don't understand why anyone would dump such an under-valued stock in
response to a single quarter's numbers. The nature of GOZ's business is
that the quarter-to-quarter progress will be lumpy; and it wasn't as if
great expectations had been built into the stock price prior to the
news. Also, the company advised that gold production reached a monthly
record during the first month of the current quarter.
In the absence of immediate and sizeable additional upside in the gold
price, it is reasonable to expect that GOZ will have to spend at least
1-2 months basing in the C$0.45-C$0.60 range before commencing its next
short-term upward trend. This is because there is probably now a lot of
supply near former support in the low-C$0.60s that will have to be
absorbed, while bargain hunting will probably create a floor in the
mid-C$0.40s.
If you don't already have a full position then it would make sense to accumulate GOZ in the C$0.45-C$0.52 range.
 Andina Minerals (TSXV: ADM). Shares: 105M issued, 119M fully diluted. Recent price: C$1.81 Andina Minerals (TSXV: ADM). Shares: 105M issued, 119M fully diluted. Recent price: C$1.81
Gold explorer ADM sold off on Tuesday in response to Monday's
post-close announcement of a C$25M equity financing (12.5M shares at
C$2.00/share).
We don't know why ADM's management is diluting the stock at this time
given that the company already has more than enough cash in the bank to
fund its activities over the next 12 months. Perhaps this just confirms
what we've said before, which is that most managers of small gold
mining companies seem to be embedded with a gene that prevents them
from saying "no thanks" when presented with the opportunity to raise
money by issuing more shares.
On the positive side of the ledger, the financing is a "bought deal"
and the new shares are being issued at a 10% premium to the market
price at the time the deal was done. This shows that some well-heeled
investors believe that ADM is worth a lot more than C$2/share.
ADM is a good candidate for new buying near the current price.
Chart Sources
Charts appearing in today's commentary
are courtesy of:
http://stockcharts.com/index.html
http://www.futuresource.com/

|

