![]()
![]()
![]()
![]()
- Interim Update 4th November 2015
Copyright
Reminder
The commentaries that appear at TSI
may not be distributed, in full or in part, without our written permission.
In particular, please note that the posting of extracts from TSI commentaries
at other web sites or providing links to TSI commentaries at other web
sites (for example, at discussion boards) without our written permission
is prohibited.
We reserve the right to immediately
terminate the subscription of any TSI subscriber who distributes the TSI
commentaries without our written permission.
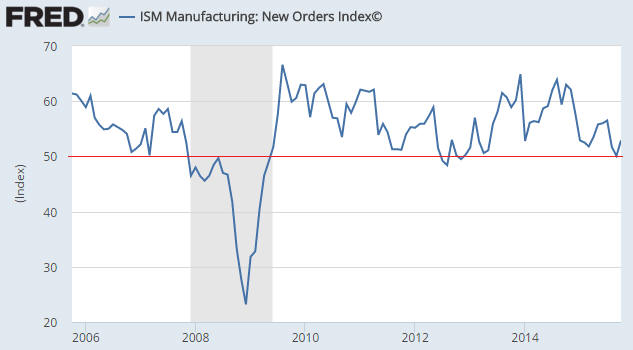
The message of the "New
Orders Index"
Unlike Real Gross Private
Domestic Investment (RGPDI), which was most recently discussed in the 2nd
November Weekly Update, the ISM New Orders Index does not have a perfect record
as a leading indicator of US economic recession. In particular, there have been
several instances where it has signaled an imminent recession (by dropping below
48) and a recession has not soon begun. Such signals are called "false
positives". However, with one exception it has generated a recession signal
shortly before or at the start of every US recession of the past 67 years,
meaning that it has generated only one "false negative" in its history. The
failure occurred in 1973, when the New Orders Index didn't break down until well
after a recession had begun. The point is that based on its history, the ISM New
Orders Index is far more likely to signal a recession that doesn't eventuate
than fail to signal a recession that does eventuate. So, what is the current
message of the New Orders Index?
The latest ISM numbers were published on Monday 2nd November. As illustrated by
the following chart, the New Orders Index ticked higher and remains in the
low-50s. This suggests that while the US economy is sluggish, it is not in
recession.
The current message of both RGPDI and the New Orders Index is that there is a
realistic possibility, but not yet a high probability, of the US economy
entering recession within the coming two quarters.
The Stock Market
The US
Corporate Profits
Well-known fund-manager and writer Doug Kass recently noted that a year ago,
S&P500 (SPY) profits were running at a $114-a-share annualised rate and
estimates for this year's EPS were up to $135 a share. But today, profits are
only running at a $107-a-share annual rate, profit margins have taken a sharp
hit, and yet the SPX is about 5% higher. In other words, the stock market's
valuation is higher now than its already-high level of a year ago despite the
fact that profits have fallen well short of expectations. How is this possible?
The answer is that expectations are still very optimistic. Like the Fed's
"lift-off", the lift-off in economic and corporate-profit growth is always
expected to happen in the not-too-distant future...but never does.
It is also worth noting that over the past several months share buybacks
generally haven't worked, that is, generally haven't resulted in relatively good
price performance. This could mean that the share buyback scheme has reached its
limit and that future growth in share prices will require genuine growth in the
underlying companies' profits.
Current Market Situation
The SPX has deviated from the 2011 Model over the past week, but this doesn't
change our short-term outlook. It also doesn't invalidate the 2011 Model,
because there will never be a good reason to expect a market's future path to be
identical to a path that was previously taken. The financial markets aren't that
straightforward.
Before reiterating our current outlook it's worth summarising how our short-term
expectations have evolved over the past few months.
A few months ago we wrote that the probability of a traditional
September-October stock market (SPX) crash was close to zero (because the
price-related set-up for a crash wasn't in place), but that there was a high
probability of a 10%-20% decline from a July peak to a low by mid-October. As it
turned out, there was a 12% SPX decline that bottomed in late-August, with the
bottom being successfully tested in late-September. We identified the successful
test of the bottom shortly after it happened and then began to anticipate a
rebound to the vicinity of the 200-day MA, all the while keeping an open mind as
to whether the July-September weakness was the first leg of a new bear market or
a correction within a continuing bull market.
Our current view is that the probability of a November-December stock market
(SPX) crash is close to zero (again, because the price-related set-up for a
crash is not in place), but that there is a high probability of a multi-week
decline that retraces about half of the rally from the late-September low. This
is regardless of whether the market has commenced a cyclical bearish trend or is
still immersed in a cyclical bullish trend. To be more specific about our
short-term expectations, we guess that the SPX will drop back to near support at
2000 within the coming few weeks.
Considering that the SPX's rebound from its late-September low has stretched to
within 1% of the May-July peak, there's a realistic chance that it will stretch
a little further and fully test the earlier peak. However, considering the
extent to which the SPX is now 'overbought' and the relative weakness in other
parts of the market (most notably the small-caps, the transportation sector and
the banking sector), we think that a solid/sustained break above the May-July
highs is very unlikely in the near future.
Gold and the Dollar
Gold
Gold and the US Economic Data
Most of the widely-followed economic numbers only matter to the extent that they
influence the Fed. The monthly employment report, for example, provides no
useful information about the current or likely future performance of the US
economy, but is important to the financial markets simply because it is
important to the Fed. Unfortunately, the Fed is now the dominant influence on
the financial markets. Long gone are the days when the markets were primarily
concerned with the efficient allocation of capital in response to genuine price
signals.
The next batch of US employment data is due this Friday. Expectations appear to
be low, in that the average of the forecasts of the people who forecast such
things is that the US economy added only 180K-190K jobs last month. The low
expectations increase the probability of a positive surprise, which would put
downward pressure on the gold price. At the same time, the gold market will be
partially insulated from near-term gold-bearish news by the fact that it has
sold off over the past two weeks.
Both the employment news and the market reaction to the employment news are
unpredictable, so it makes no sense to bet on a specific near-term outcome.
However, the market reaction to the news could provide clues about the future.
If it does, you can be sure that we'll mention the clues in the coming Weekly
Update.
Looking beyond the knee-jerk reactions to the news of the day, we see a gold
market stuck in limbo. In this no-man's land between a definitively-bullish and
a definitively-bearish fundamental backdrop for gold, the US$ gold price works
its way higher during periods when it seems that the start of the Fed's
rate-hiking is being pushed out and works its way lower during periods when it
seems that the start of the Fed's rate-hiking is being brought forward.
To get out of this 'limbo' and into a situation where a more substantial gold
rally is probable, it appears that one of two things will have to happen. Either
the Fed will have to take the first step along the rate-hiking path, or the
economic/stock-market situation will have to become bad enough that additional
monetary easing will be the Fed's obvious next move. In other words, the Fed
will have to stop vacillating and move one way or the other.
Although counterintuitive, there are two good reasons to expect that a Fed rate
hike would usher-in a more bullish period for gold. The first reason is that it
would potentially be a "sell the rumour buy the news" situation. We are
referring to the fact that when a market sells off in anticipation of
ostensibly-bearish news, the arrival of the actual news will often lead to a
wave of short-covering and an upward price reversal. The second and more
interesting reason is that it would spark the realisation that in the current
circumstances a Fed rate hike does not entail monetary tightening. As we've
explained over the past couple of years, the Fed has inundated the banking
system with such a massive quantity of excess reserves that it can no longer
hike the Funds Rate in the traditional way -- by reducing bank reserves and the
money supply. Instead, future Fed rate hikes will be implemented by boosting the
interest rate that commercial banks earn on their reserves. So, rather than
resulting in reduced reserve levels, any Fed rate hikes implemented in the
foreseeable future will result in INCREASED reserve levels due to the payment of
a higher interest rate on existing reserves.
Current Market Situation
The US$ gold price has just fallen for 6 days in a row and on 13 of the past 15
trading days. A consequence is that after being short-term 'overbought' as
recently as three weeks ago, the gold market is now short-term 'oversold'. This
should enable a rebound to begin immediately or after the Employment-Report dust
settles. However, with the gold price having broken solidly below channel
support over the past two trading days (refer to the following chart) and with
more time required to turn the COT situation bullish, the next tradable rally (a
rally that lasts at least a few weeks and adds at least $100 to the price) is
unlikely to begin in the near future. Instead, any rally that begins over the
next few days will probably end in the vicinity of the 50-day MA.
Gold Stocks
The HUI was expected to make its way down to support at 118-120, which it has
done. It is not yet short-term 'oversold', but a rebound could soon begin. If
so, the rebound would likely be limited by the 128-130 range that acted as
support during the second half of October.
We'll take the evidence as it comes, but our best guess based on what's known
right now is that the next meaningful rally in the gold-mining sector will begin
around mid-December. Our reasons are:
1) Short-term reversals from down to up occurred in mid-December during each of
the past two years.
2) It's likely to take several more weeks for the COT situation to become a
tail-wind for the gold price.
3) Almost regardless of what it contains, the FOMC announcement on 16th December
could be a positive catalyst for gold bullion and gold-mining stocks. That will
especially be the case if gold-related investments are near multi-week price
lows just prior to the announcement.
Although more time is almost certainly needed to set the stage for the next
meaningful rally in the gold-mining sector, more price weakness isn't
necessarily required. We think that the HUI's short-term downside risk is
defined by the September low in the 100-105 range, but rather than dropping all
the way back to the September low it's possible that the HUI will spend the next
few weeks ranging between support at its 50-day MA and resistance at 130.
An implication of the above paragraph is that if the HUI is going to avoid a
test of its September low it will have to avoid a daily close below its 50-day
MA, which is currently at 118.
The Currency Market
The Dollar Index is now in almost the same position it was in at this time last
week. It is short-term 'overbought' and needs to hold onto the bulk of
Wednesday's gain until the end of the week to confirm an upside breakout from
its intermediate-term consolidation pattern.
Similar to what happened in August, we expect that the Dollar Index will decline
in parallel with the next multi-week decline in the US stock market. This
probably means that regardless of whether or not an upside breakout is confirmed
by the weekly close, the Dollar Index will soon commence a pullback.
A routine pullback would take the price down to around 96.
Updates on Stock Selections
Notes: 1) To review the complete list of current TSI stock selections, logon at
http://www.speculative-investor.com/new/market_logon.asp
and then click on "Stock Selections" in the menu. When at the Stock
Selections page, click on a stock's symbol to bring-up an archive of
our comments on the stock in question. 2) The Small Stock Watch List is
located at http://www.speculative-investor.com/new/smallstockwatch.html
Chart Sources
Charts appearing in today's commentary
are courtesy of:
http://stockcharts.com/index.html
http://research.stlouisfed.org/
![]()