|
- Interim Update
5th March 2014
Copyright
Reminder
The commentaries that appear at TSI
may not be distributed, in full or in part, without our written permission.
In particular, please note that the posting of extracts from TSI commentaries
at other web sites or providing links to TSI commentaries at other web
sites (for example, at discussion boards) without our written permission
is prohibited.
We reserve the right to immediately
terminate the subscription of any TSI subscriber who distributes the TSI
commentaries without our written permission.
Collapsing money-supply growth in China
The People's Bank of China (PBOC) doesn't provide sufficient
information to enable the calculation of True Money Supply (TMS), so
when determining China's monetary inflation rate we have to look at
the M1 and M2 aggregates. This is not ideal, but better than
nothing.
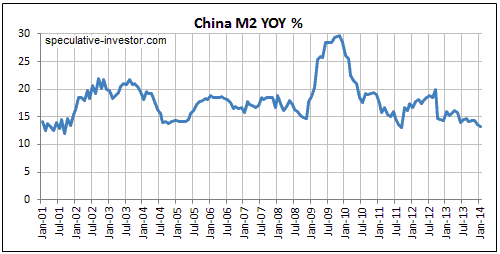
The first of the following charts shows that while the
year-over-year (YOY) rate of growth in China's M2 money supply is
still well into double digits and high by developed-economy
standards, it is near its lowest level of the past 10 years. Of far
greater interest, however, is the second of the following charts,
which shows that the YOY rate of growth in China's M1 money supply
has collapsed to a 15-year low of just 1.2%
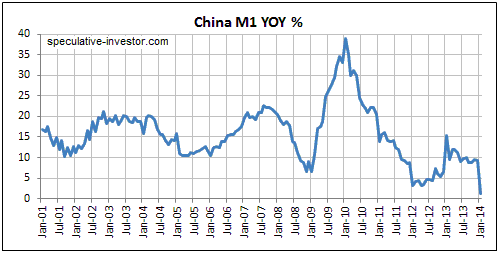
The recent plunge in China's M1 growth rate is far more important than the
recent small decline in the Yuan's exchange rate, although the two events could
be related. Both resulted from deliberate actions on the part of China's
policymakers.
The PBOC could quickly change (loosen) the monetary backdrop by injecting a
large quantity of new money into the country's banking system over the next few
months, but if it chooses not to it will likely set in motion an economic bust.
China's policy-makers certainly do not want an economic bust, but central
planners in China have no better understanding of the indirect effects of their
actions than do their Western counterparts.
Not good, but
not quite as dismal
In response to the 'shocking' plunge in the US
manufacturing sector's New Orders Index reported by the ISM (Institute of Supply
Management) in early February, we wrote:
"It's distinctly possible that January's ISM data painted an inaccurately
dismal picture, perhaps due to unusually cold weather across much of the US
during the month. We won't know until early March when we get to see the
February data. However, we certainly can't rule out the possibility that the
data are accurate and that the US economy is now tanking.
When rapid monetary inflation creates the appearance of economic strength by
propping-up prices and artificially boosting demand, the economy will usually
deteriorate with 'surprising' speed following a significant reduction in the
rate of money-supply growth."
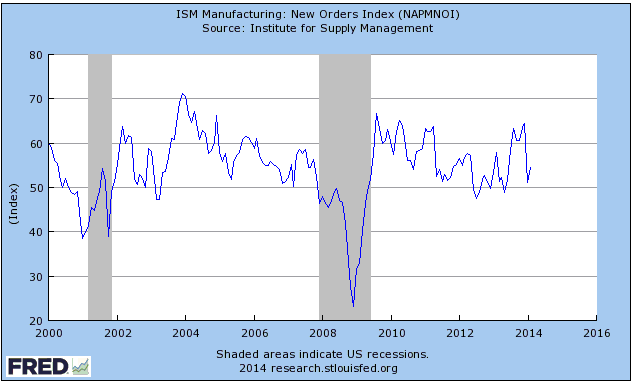
Unfortunately, the latest monthly manufacturing-sector numbers from the ISM
didn't clarify the situation. The small bounce in the ISM New Orders Index in
February (see chart below) means that the bulk of January's plunge was retained,
but the unusually severe winter weather was still having an effect last month.
More data will therefore be required to determine if slowing money-supply growth
has begun to take its inevitable toll on the mal-investments that were
'stimulated' by the ultra-loose monetary policies of the past few years, or if
the weak numbers reported over the past two months are mostly a temporary effect
of bad weather.
 The Stock Market
We expect the US stock market to experience a steep 3-6 month
decline this year, regardless of whether or not its cyclical bullish trend
remains intact. Sentiment, valuation, slowing money-supply growth, the long
period since the last meaningful correction and the Presidential Cycle Model all
point to such an outcome. However, the decline has obviously not yet begun.
After having become moderately 'oversold' early last month, the market is now
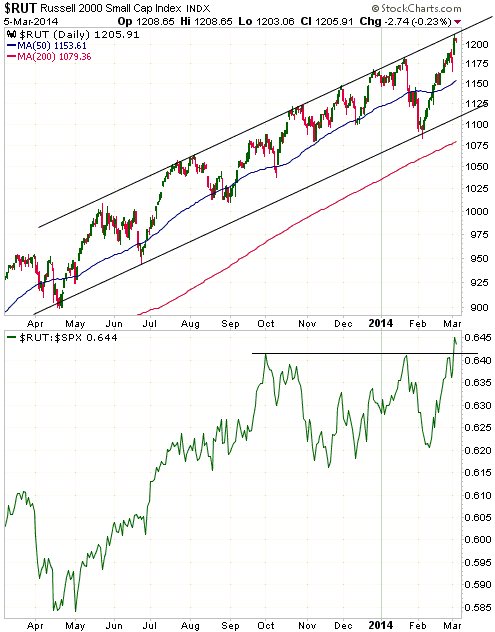
'overbought'. The S&P500 Index (SPX) is still 15-20 points (about 1%) below the
top of the price channel that has limited rallies over the past 12 months, but
the top section of the following daily chart shows that the Russell2000
Small-Cap Index (RUT) touched its channel top on Wednesday 5th March. There
could be a bit more strength over the days ahead, enabling the SPX to also reach
its channel top, but the market is probably not far from some sort of peak in
terms of both time and price.
The bottom section of the following chart suggests that a peak at this time
would probably not hold for more than a few weeks. We are referring to the fact
that the RUT/SPX ratio has confirmed this week's new highs in both the RUT and
the SPX by rising to a multi-year high of its own.
We'll take the price evidence as it comes, but at this stage we suspect that 2-4
weeks of 'corrective' activity will soon begin and that an intermediate-term
high will wait until the second half of April or the first half of May.
Gold and the Dollar
Gold
Gold and Military Conflict
Some of the people who are now pontificating about the situation in Ukraine as
if they were experts on the topic couldn't, as recently as two months ago, have
answered questions like "What is the capital city of Ukraine?" and "In which
country is the Crimea located?" We have resisted the temptation to discuss
Ukraine in these pages because we don't pretend to have valuable insight into
the political and geopolitical events unfolding in that country. The one insight
we can offer is this: the situation in Ukraine is irrelevant to the investment
case for gold and to gold's price performance beyond short-term fluctuations.
In more general terms, there is often an increase in the speculative demand for
gold in reaction to international military conflict or the rising risk of
international military conflict, causing the gold price to quickly gain some
ground. However, the price gains made on the back of such developments are never
sustained.
Buying gold in response to rising tensions between militarily-significant
governments is more akin to superstition than reasoned analysis. The fact is
that military action is only bullish for the US$ gold price to the extent that
the action results in either meaningful "inflation" or meaningful economic
weakness in the US and/or Europe, but even in these cases the initial rally will
be retraced.
Consequently, when the gold price spikes higher in reaction to a brewing
geopolitical issue of potentially global importance it should be viewed as
either a short-term selling opportunity or a signal to hold off on new buying.
It should not be viewed as a short-term buying opportunity.
Up until now the gold price hasn't moved by much in reaction to the goings-on in
Ukraine. There was a 2% rise on Monday 3rd March, but this wasn't sufficient to
create an upside breakout and the bulk of this gain was given back the next day
when tensions eased. It is possible, however, that the conflict will escalate
and the gold price will surge in response. Just bear in mind that any
price-surge in response to news of this nature would likely be retraced in full.
Current Market Situation
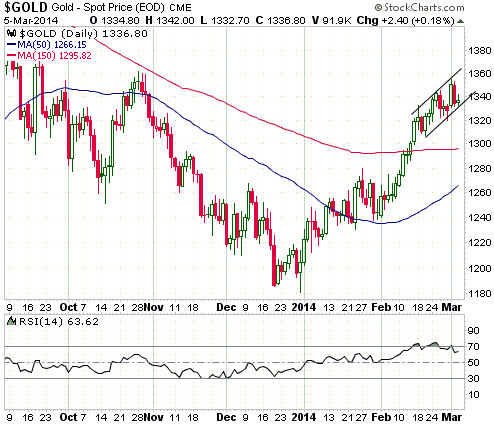
Gold's short-term upward trend hasn't experienced much of a correction over the
past few weeks. The price has continued to make higher highs and higher lows,
although the rate of ascent has slowed and this has enabled the daily RSI (refer
to the bottom of the following chart) to ease back to the low-60s.
A decline to support in the $1270s is now less likely, but the gold market
retains the potential to drop back to the low-$1300s before resuming its
short-term upward trend. A daily close below $1330 would signal that such a
decline was about to happen, whereas breaking above resistance in the low-$1350s
would suggest that a rise to $1400-$1430 was underway.
Gold Stocks
Current Market Situation
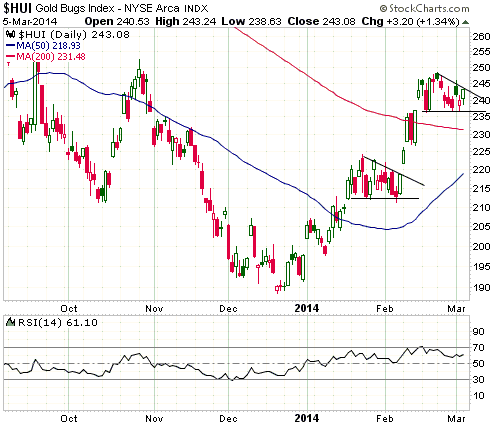
At this stage the HUI's correction from its February high looks similar to the
correction from its January high. If the similarities continue then the
intra-day low of the past week will not be breached on a daily closing basis and
the short-term upward trend will resume within the next few days. This is one of
the two most likely outcomes.
The second of the two most likely outcomes involves the HUI dropping to the
mid-220s before resuming its short-term upward trend. A daily close below 236
would indicate that this scenario was probably happening.
In other words, neither of what we perceive to be the two most likely near-term
scenarios involves meaningful price weakness.
By the way, the fact that the gold sector has consolidated over the past 2-3
weeks while the broad stock market has ramped upward reduces the risk that a
decline in the broad stock market over the weeks ahead will hurt the average
gold-mining stock.
Turkeys are flying
The current market for junior gold-mining stocks seems almost random. Many
juniors have rallied strongly over the past couple of months, but relative
performance doesn't appear to be well correlated with genuine economic
potential. In particular, there are many examples of junior gold stocks with
gold deposits that have no realistic chance of ever being mined or being of
interest to a larger company outperforming junior gold stocks with much
higher-quality assets. In some cases, turkeys are flying higher than eagles.
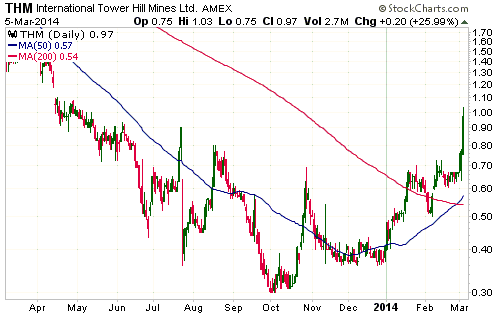
A good example is International Tower Hill Mines (THM), a former TSI stock
selection. This company has a lot of in-ground gold at its Livengood project in
Alaska, but a feasibility study published last year revealed that this project
would currently need a gold price of $2,000/oz to be economically viable. Any
project that currently needs a gold price of $2,000/oz to be viable will never
be viable, because by the time the gold price moves up to $2,000/oz the costs to
build and operate a mine will be a lot higher. The Livengood project therefore
has a small amount of option value, but very little chance of ever being
developed into a profitable mining operation. And yet, speculators have bid THM
up by more than 200% since its Q4-2013 bottom and 45% since the beginning of
this week. The stock chart looks bullish (see below), but this company now has a
market cap of about US$100M and an enterprise value of about US$85M. That's a
hefty price to pay for a small amount of option value.
The stock market's recent unwillingness to differentiate based on quality is
creating a good opportunity for value-oriented speculators in junior mining
stocks who, thanks to mistakes made over the past couple of years, own some
flying turkeys. The opportunity is to improve portfolio quality by selling the
flying turkeys and buying the stocks of companies with genuine economic
potential, the idea being that the market will eventually care about relative
quality.
Currency Market Update
There is always more than one way to interpret a price chart. One interpretation
-- the interpretation that makes the most sense to us -- of the following daily
chart of the Dollar Index is that there was a downside breakout from a
multi-month consolidation pattern in February. Under this interpretation the
Dollar Index could rebound as far as 80.7 over the next couple of weeks, but the
direction of the next tradable trend will be down.
Our interpretation would be called into question by a daily close above 81 and
completely negated by a weekly close above 81.6.
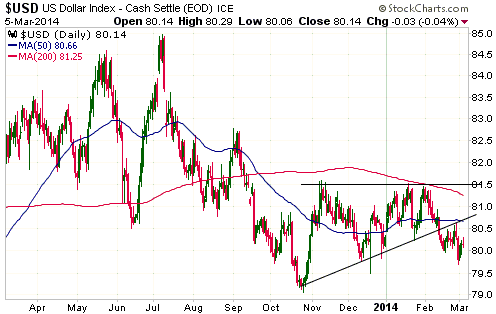
Our short-term US$ outlook has shifted from "neutral" to "bearish". This outlook
is contingent upon the Dollar Index remaining below 81 on a daily closing basis.
Updates
on Stock Selections
Notes: 1) To review the complete list of current TSI stock selections, logon at
http://www.speculative-investor.com/new/market_logon.asp
and then click on "Stock Selections" in the menu. When at the Stock
Selections page, click on a stock's symbol to bring-up an archive of
our comments on the stock in question. 2) The Small Stock Watch List is
located at http://www.speculative-investor.com/new/smallstockwatch.html
Chart Sources
Charts appearing in today's commentary
are courtesy of:
http://stockcharts.com/index.html
http://research.stlouisfed.org/

|

