|
- Interim Update 5th April 2006
Copyright
Reminder
The commentaries that appear at TSI
may not be distributed, in full or in part, without our written permission.
In particular, please note that the posting of extracts from TSI commentaries
at other web sites or providing links to TSI commentaries at other web
sites (for example, at discussion boards) without our written permission
is prohibited.
We reserve the right to immediately
terminate the subscription of any TSI subscriber who distributes the TSI
commentaries without our written permission.
TSI Schedule Change
Please note that there won't be an Interim Update on Thursday the 13th
of April. Also, the Weekly Market Update that would normally have been
posted on Sunday the 16th of April (Easter Sunday) will, instead, be
posted on Monday the 17th of April.
Responses to E-mails
Due to time constraints we usually aren't able to personally respond to
market- or stock-related questions e-mailed by subscribers (if we did
respond to all, or even to half, of the e-mails we receive we wouldn't
have much time left to do anything else). However, we read every e-mail
and the e-mails we receive often give us ideas on topics to discuss in
the TSI commentaries. We therefore welcome your market/stock-related
questions and comments, even though we probably won't be able to
provide a personal response.
Note, though, that we WILL reply to all administration-related
questions e-mailed to us -- questions to do with site access or
subscription payments, for instance -- within 24 hours. We will also
reply to all e-mails requesting a change of subscription status within
24 hours. Therefore, if you don't receive a reply to this type of
question/request within 24 hours you should assume that either we
haven't received your e-mail or that our reply, for some reason, has
not made it to your inbox. In this case you should ensure that e-mails
received from sas888_hk@yahoo.com will not be blocked by a spam filter
(this can usually be done by putting the aforementioned address into a
"Safe List" in your e-mail account), and then re-send your
question/request.
The Stock Market
Short-term interest rates and the stock market
...the Fed will continue to hike the official short-term interest rate until after US equities commence their next bear market.
The following chart compares the performance of the S&P500 Index
with the performance of the yield on a 2-year Treasury Note. Clearly,
over the 8-year period covered by this chart the 2-year interest rate
and the US stock market have moved in lock-step, that is, rising trends
in short-term interest rates have invariably been accompanied by rising
trends in the stock market, and vice versa. Notice, for example, that
the 2-year interest rate and the S&P500 bottomed together during
October of 1998 and then rallied together into the first half of 2000.
Notice, as well, that the S&P500 embarked on a major bear market in
March of 2000 while the 2-year yield began a major bear market of its
own a couple of months later; and that within 3 months of the
March-2003 beginning of a cyclical bull market in the S&P500 Index
the 2-year yield began to trend relentlessly higher.
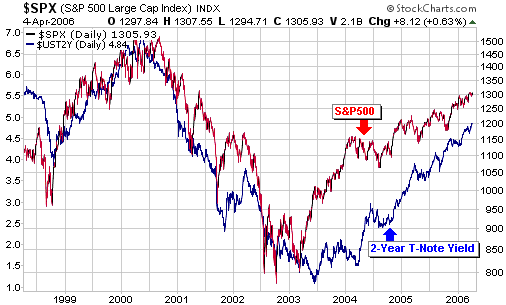
Now, short-term
interest rates in the US are controlled by the Fed. The above chart
therefore makes the case that the Fed's monetary policy has been, and
continues to be, strongly influenced by what is happening in the stock
market. Specifically, the chart implies that the Fed can be relied upon
to cut interest rates in response to persistent stock market weakness
and to hike interest rates in response to persistent stock market
strength.
We think the chart's message is that the Fed will continue to hike the
official short-term interest rate until after US equities commence
their next bear market. The idea that the stock market outlook is
bright because the Fed is about to end its rate-hiking is therefore
nonsensical since the thing that is most likely needed in order for the
Fed to end its rate hiking is the commencement of a large and lengthy
downturn in the stock market.
Current Market Situation
...over
the past few months it has generally been the case that the lower the
quality of the stock the better the stock's performance.
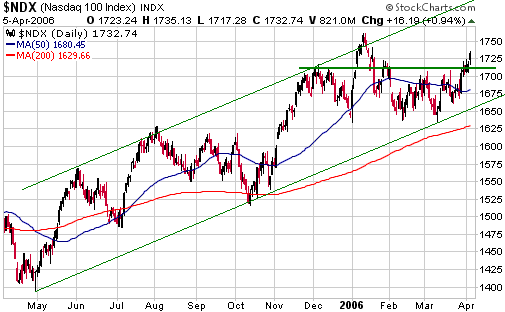
The following chart shows that the NASDAQ100 Index (NDX) has just
broken above resistance. We can't be short-term bearish on the US stock
market in the face of this price action, but neither can we be
short-term bullish given the evidence -- discussed in previous
commentaries -- that an important peak is close at hand. We are
therefore going to retreat to a "neutral" position as far as our
short-term outlook is concerned.
This week's price action suggests that the NDX is going to test its
January peak, but the risk, for stock market bears, is that it will do
a bit better than that and move up to the top of the channel in which
it has oscillated over the past year. On the other hand, a close below
1700 within the next few days would indicate that this week's
mini-breakout was false and would shift us back to a short-term bearish
stance.
John Hussman's Weekly Market Comment is always worth reading (except when he discusses inflation), but we found his latest piece
particularly interesting. In it he deals with the extreme
out-performance, over the first 3 months of this year, of what he
refers to as "garbage stocks" -- stocks that everyone can make money on
just so long as, and no longer than, everyone can continue to hold his
nose and avert his eyes and imagine that the garbage is actually
nourishing and palatable.
According to Dr Hussman: "Among
stocks belonging to the S&P 500, those rated "A" or "highest
quality" have gained just 1.01% year-to-date. In contrast, companies
rated "B -" or "lower quality" have gained 10.17% year-to-date. At the
bottom of the quality barrel, those S&P 500 companies rated "C" or
"D" for "lowest quality" (or in reorganization) have gained a striking
16.90% year-to-date.
The pattern is the same
in the Russell 2000, where the highest, lower, and lowest quality
stocks in the index have posted average year-to-date gains of 7.38%,
13.03% and 20.09%, respectively."
He goes on to say: "One need not
predict an abrupt end to this low-quality rally to recognize that it's
dangerously mature. Over the past 3 years, the average price/revenue
and price/book ratios of the lowest quality stocks have virtually
doubled (from 1.26 to 2.57 times revenues, and from 1.67 to 3.15 times
book value). In contrast, the valuations of the highest quality stocks
have remained constant or actually decreased (from 2.16 to 2.17 times
revenues, and from 3.95 to 3.64 times book value).
When the market treats
the average dollar of low quality, post-recovery, highly cyclical,
potentially bankrupt revenue as worth more than the average dollar of
high quality, stable and dependable revenue, something is seriously
wrong with investors' judgments. Essentially, investors are not only
relying on the revenues of low quality companies to be stable, they're
assuming those revenues will grow faster and amount to more over the
long-term."
The phenomenon discussed by Dr Hussman is one that anyone who follows
the performance of a wide range of resource-oriented stocks should be
very familiar with. In the resource sector of the stock market over the
past few months it has generally been the case that the lower the
quality of the stock the better the stock's performance. "Blue chips"
such as Newmont Mining and Phelps Dodge have been laggards, while the
stocks of companies with speculative potential but not much else have
soared. As owners of many of what Dr Hussman would term "garbage
stocks" (they are not actually garbage, by the way, because they own
valuable in-ground resources, but in many cases they are years away
from generating any profits) we don't mind this at all, but we do
recognise that it is something that happens near the END of an
intermediate-term advance.
Gold and
the Dollar
A "core position" in the gold sector
...none
of the stocks in our portfolio are core holdings in the true meaning of
the term. This is because every stock is always for sale at the right
price. We don't, however, let our overall exposure drop below a certain
percentage.
We occasionally refer to the desirability of maintaining a core position in gold stocks. But what actually is a "core position"?
By way of explanation, let's assume you are very confident that the
gold sector of the stock market is in a long-term upward trend that is
likely to continue for at least another five, and perhaps as much as
another fifteen, years. As a result of this long-term outlook you might
decide to become fully invested in gold stocks and to remain that way
throughout the bull market. One problem with this 'boots and all'
approach, though, is that you will experience huge portfolio draw-downs
during the intermediate-term corrections and, as a consequence, you
might end up abandoning your correct long-term view at the worst
possible time because the short-term pressure simply becomes too great.
Another problem with adopting an approach that entails staying 100%
invested throughout the long-term bull market is that you might not be
able to identify the end of the bull market when it eventually arrives.
After all, in real time the first downward leg in a new bear market
will often be indistinguishable from the large corrections that
punctuated the prior bull market.
On a related matter, it's important to note that whether something is
or isn't in a bull market will always be a matter of opinion as opposed
to a matter of fact. For example, it is a fact that gold has been in a
bull market since the first half of 2001, but it is not a fact that
gold is in a bull market right now. This is because there's a chance,
however slim, that the bull market ended 5 minutes ago. This is just
another way of saying that regardless of what anyone thinks they know,
nobody KNOWS the future. When it comes to the future we just make
guesses, some of which are more educated than others.
An alternative to the 'boots and all' approach to participating in a
long-term bull market is to maintain a "core" level of exposure to the
bull market at all times, where "core" refers to a minimum that you
won't go below as long as you remain confident that the direction of
the long-term trend is up. The idea would be to increase your exposure
to well above your core exposure during those times when the
intermediate-term risk/reward looked favourable and to retreat to the
"core" during those times when the intermediate-term risk appeared to
outweigh the reward. This is our preferred approach because it a)
prevents you from ever missing a major advance, b) takes into account
the fact that you can never be absolutely certain about the future
direction of market prices, and c) gives you a smoother ride.
The appropriate "core position" will vary from person to person
depending on, for example, personal financial situation, age, risk
tolerance, experience, investment objectives, and level of confidence
in the long-term trend. The main thing to understand is that when we
talk about having a "core position" in the gold sector (or anywhere
else) we are referring to the exposure to that sector as a percentage
of total portfolio value, not to a specific group of stocks. Although
there are some stocks that we consider long-term investments and others
that we will be quicker to sell as opportunities present themselves,
none of the stocks in our portfolio are core holdings in the true
meaning of the term. This is because every stock is always for sale at
the right price. We don't, however, let our overall exposure drop below
a certain percentage.
Because the core position represents a minimum percentage rather than a
specific set of stocks, the composition of the "core" will vary.
Periodically, stocks will become too expensive, or it will become
apparent that their stories are not panning-out as bullishly as had
previously been expected, and they will be replaced with other stocks
that appear to have higher long-term reward/risk ratios. There are,
however, a couple of general rules that we apply when selecting gold
(and other metal) stocks for a core position.
First, the stock's valuation must be low based on currently-defined
resources and conservative gold price assumptions. Second, we must have
a good reason to expect that the stock will outperform the gold price
by a wide margin over the ensuing 3 years. We'll further explain by
considering some specific examples.
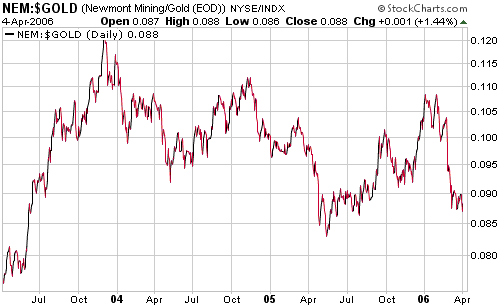
This will probably surprise a lot of readers, but a stock that we would
NOT want as part of a core position is Newmont Mining (NYSE: NEM). We
sometimes read that NEM is a "must own" gold stock because the company
has a strong balance sheet, a diverse set of high-quality assets and
the best management in the business, to which we would respond: why
MUST we own a gold stock that has under-performed the gold price for
more than 2 years (refer to the NEM/gold chart below) and stands little
chance of outperforming gold by a healthy margin -- a margin high
enough to warrant assuming the greater risk of owning a gold mining
stock rather than owning gold bullion -- over the next several years?
NEM's sloppy performance relative to the gold price is most likely due
to a combination of four things: rising costs (a significant chunk of
whatever benefit the company would have received from a higher gold
price has been offset by higher production costs), slow growth,
heightened political risk in Peru (the company's Peru-based operations
generate a large slice of its total profit and it looks like a Marxist
with larceny on his mind is about to become the president of this
country), and the fact that NEM has become a high-profile target of
environmentalists. Importantly, none of these problems/risks are likely
to go away.
In short, we might trade NEM from time to time, but we don't like it as
a long-term investment because we don't have a good reason to expect
that it will outperform the gold price over the next few years. If we
were uncomfortable owning the exploration/development-stage companies
then we'd opt for a gold bullion surrogate such as streetTRACKS Gold
Shares (NYSE: GLD) rather than NEM.
A stock that we have
had as a core position over the past three years is NovaGold Resources
(TSX and AMEX: NG). During this period NG has done well relative to the
gold price (see chart below), meaning that NG shareholders have been
rewarded for assuming the added risk of owning a gold mining stock as
opposed to the much-safer gold bullion. Furthermore, although it now
has a high market capitalisation for an exploration-stage stock it
stands a good chance of out-performing the gold price over the next few
years due to the enormous quantity and high quality of its proven
in-ground resources and the strong potential for resource expansion. We
doubt, though, that the extent to which NG outperforms the gold price
in the future will be anywhere near as great as the extent to which it
outperformed in the past because the stock is no longer at a
bargain-basement level.

For information
purposes we'll note that in our own portfolio we have, over the past
few weeks, scaled back to our "core" exposure. At this time we are
about 50% cash, 35% gold/silver stocks and warrants, and 15%
non-gold/silver commodity stocks and other positions. At this stage we
expect to remain close to this core exposure until after a large
correction has reduced the downside risk.
Gold and Silver
...as
long as the markets keep pushing higher in anticipation of easier
monetary policy the odds will be in favour of monetary policy becoming
tighter.
As explained in the latest Weekly Update, there is plenty of technical
evidence to suggest that gold and silver -- particularly silver --
might be about to reverse lower, with the first week of April (this
week) being a likely time for such a reversal.
In 2004, similar price action led to sharp downturns beginning on
Friday the 2nd of April -- the day that the March Employment Report was
released in the US. This year the March Employment Report is due to be
released on Friday the 7th of April, so if the metal markets get past
this Friday without suffering downward reversals then the orderly rally
in the gold market and the upside blow-off in the silver market will
probably extend into the second half of this month.
As far as the upcoming employment news is concerned, the equity, gold,
commodity and bond markets would probably prefer modestly-weak
employment growth to very strong employment growth. Throughout much of
the past 9 months the markets have been anticipating an end to the
Fed's rate hikes and a weak employment report would intensify the
anticipation, although as discussed earlier in today's commentary the
Fed will probably not end its rate hiking until some time after the
stock market commences an intermediate-term decline. In other words, as
long as the markets keep pushing higher in anticipation of easier
monetary policy the odds will be in favour of monetary policy becoming
tighter.
Gold and Silver Stocks
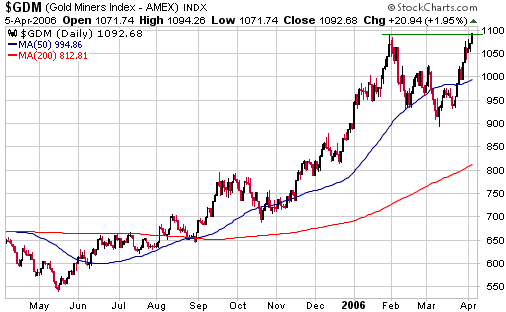
The gold stock indices find themselves is different situations. The
following chart shows that the AMEX Gold Miners Index (GDM) has just
closed at a new high, but at the same time the HUI and the XAU remain
about 1% and 5%, respectively, below their January peaks. Obviously, it
won't take much additional strength from here to push these
non-confirming indices to new highs and negate our view that an
intermediate-term correction commenced at the end of January. If this
happens then the indices will stand a good chance of gaining another
10% or so over the ensuing 2-3 weeks and the blow-off moves at the
speculative end of the market will continue. As is the case with the
metals, Friday could prove to be a pivotal day for gold and silver
equities.
Regardless of whether or not new highs are reached in the near future
we think there's a high probability of the March lows (278 for the HUI,
122 for the XAU and 894 for the GDM) being tested within the next 3
months.
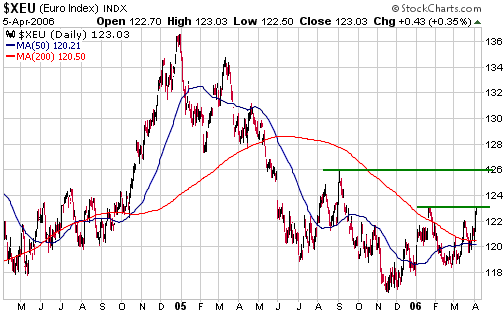
Currency Market Update
The following chart shows that the euro is currently testing resistance
at 123. We've been expecting that this resistance -- equivalent to
support at 88 for the Dollar Index -- would hold if tested in the near
future, but a move up to challenge the important resistance that lies
at 126 (equivalent to support at 86 for the Dollar Index) now looks
like a good bet prior to the euro resuming its cyclical bear market.
However, things could take another turn as a result of a surprisingly
strong US Employmemt Report on Friday, so we'll leave any further
comments on the currency market's short-term outlook for Sunday's
commentary.
Update
on Stock Selections
(Note: To review the complete list of current TSI stock selections, logon at http://www.speculative-investor.com/new/market_logon.asp
and then click on "Stock Selections" in the menu. When at the Stock
Selections page, click on a stock's symbol to bring-up an archive of our comments on the stock in question)
 We
have decided to exit Broadwing Corp. (NASDAQ: BWNG) because the large
rally in the stock price over the past few months has, in our opinion,
resulted in the intermediate-term downside risk becoming greater than
the upside potential. We'll be recording a loss of 14% based on our
March-2004 entry at a split-adjusted $18.20 and Wednesday's closing
price of $15.72, but anyone who bought the stock following any of our
re-recommendations over the past 18 months should have a gain of at
least 150%. Anyone who bought following our original recommendation and
who followed our preferred 'scale-in' approach should also have fared
quite well. We
have decided to exit Broadwing Corp. (NASDAQ: BWNG) because the large
rally in the stock price over the past few months has, in our opinion,
resulted in the intermediate-term downside risk becoming greater than
the upside potential. We'll be recording a loss of 14% based on our
March-2004 entry at a split-adjusted $18.20 and Wednesday's closing
price of $15.72, but anyone who bought the stock following any of our
re-recommendations over the past 18 months should have a gain of at
least 150%. Anyone who bought following our original recommendation and
who followed our preferred 'scale-in' approach should also have fared
quite well.
BWNG has been pushed sharply higher over the past few months by a
combination of short-covering, general enthusiasm for the stocks of
optical networking companies, and speculation that the company will be
involved in the consolidation taking place in the telecom industry. We
think that significant upside potential remains, but there's also now a
lot more risk because the market is now anticipating some positive
developments for the company (6 months ago the market seemed to be
discounting a worst case scenario for BWNG, meaning that there was
little chance of a negative surprise and plenty of scope for an upward
re-rating).
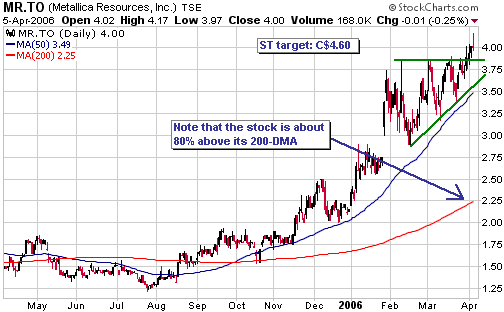
Although the Metallica Resources warrants (TSX: MR.WT) have risen
substantially since we added them to the TSI Stocks List last November,
they remain significantly under-valued relative to the stock.
Specifically, at Wednesday's closing price of C$4.00 for the stock
(TSX: MR) we calculate the fair value of the warrants to be C$1.70.
However, they closed at C$1.43 on Wednesday.
The following chart shows that MR -- one of our favourite long-term
investments in the gold/silver sector -- is in the process of breaking
upward from a multi-week consolidation pattern. The technical objective
created by this breakout is C$4.60, but with the stock already about
80% above its 200-day moving average the short-term downside risk is
too large to justify doing any new buying of the stock at this time.
The warrants, however, still offer a reasonable short-term risk/reward,
provided they can be purchased at around C$1.40 or lower and
particularly if they are purchased as part of a longer-term
accumulation plan. This is because a 15% move up to C$4.60 by the stock
price would increase the fair value of the warrants to around C$2.20
(more than 50% above Wednesday's closing price). We think the warrants
have short-term downside risk of around 30%.
Many exploration-stage gold and silver stocks have gone parabolic over
the past several weeks. While these moves could continue for a short
time, the parabolic stage of a rally will often be retraced in full
during the ensuing correction. Buying after a stock is already well
into a vertical ascent is therefore very risky.
An exploration-stage gold stock with huge long-term upside potential,
but has not yet gone parabolic and has good support within 10% of the
current price, is Canarc Resource (TSX: CCM). CCM is a stock that could
be bought at this time near the current price.
Chart Sources
Charts appearing in today's commentary
are courtesy of:
http://stockcharts.com/index.html

|