![]()
![]()
![]()
![]()
- Interim Update 5th April 2017
Copyright
Reminder
The commentaries that appear at TSI
may not be distributed, in full or in part, without our written permission.
In particular, please note that the posting of extracts from TSI commentaries
at other web sites or providing links to TSI commentaries at other web
sites (for example, at discussion boards) without our written permission
is prohibited.
We reserve the right to immediately
terminate the subscription of any TSI subscriber who distributes the TSI
commentaries without our written permission.
TSI Schedule Change
We will be travelling over the
next week-and-a-bit. Consequently, although a Weekly Update will be posted
at around the usual time this Sunday (9th April), it will be a barebones
edition. Specifically, it will contain only brief comments on the recent
price action and discuss the company news associated with TSI stocks (a
few of our stocks had important news over the first three days of this
week). Also, there won't be an Interim Update next week, but we will send
out a quick update via email if something unexpectedly dramatic happens or
we think that urgent action is appropriate.
Normal programming will
resume with the Weekly Update scheduled to be published on Sunday 16th
April.
Important breakouts or
reversals will happen in the next few days
The currency, bond and gold
markets are tightly inter-linked, meaning that a change in any one market
will usually be associated with a change in the other two markets. This is
most clearly illustrated by the chart-based comparison of the gold price
and the bond/dollar ratio that we show from time to time.
Each of
these markets ended Wednesday's trading session near significant
resistance levels, so each one is set to either break out to the upside or
reverse downward within the coming few days. Whether any one of these
markets breaks out or reverses will likely either determine what happens
or be a consequence of what happens to the other markets.
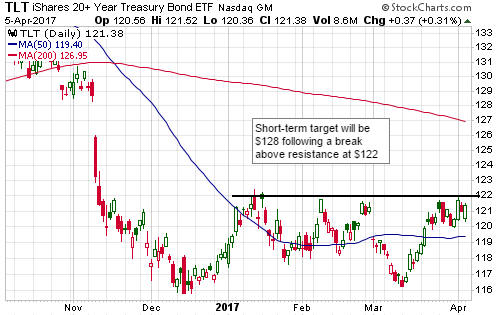
For
example, a break above resistance at $122 by TLT (the 20+ Year Treasury
ETF, a proxy for the long end of the US government bond market) would
likely be associated with a downward reversal in the Dollar Index and a
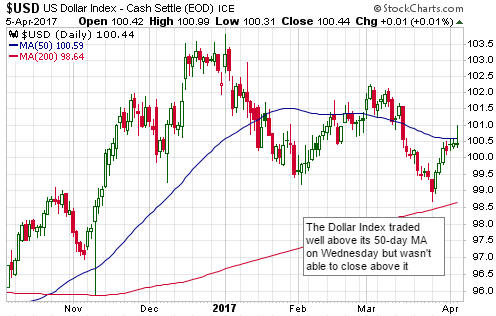
break above resistance at $1265 by gold. For another example, a break by
the Dollar Index above its 50-day MA would likely be associated with
downward reversals in TLT and the US$ gold price.
Here are the
relevant charts.
The Stock Market
The US
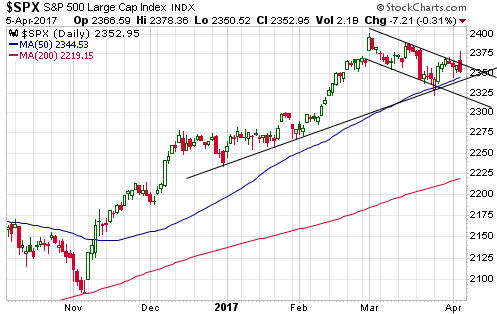
The S&P500 Index (SPX) has substantial downside potential, but having
experienced only a minor correction following the sharp rise to the 1st
March peak there is a realistic chance of another multi-week upside
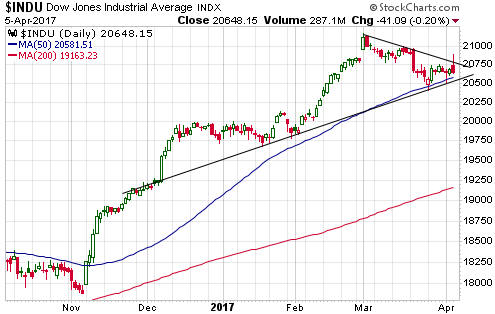
blow-off. The same applies to the Dow Industrials Index, which did no more
than pull back to its 50-day MA following its 1st March blow-off top.
For the Dow, a daily close above 20,800 would point to the multi-week
upside blow-off scenario whereas a daily close below 20,500 would open the
door to a significant multi-week decline. Interestingly, early in
Wednesday's trading session it looked like the Dow was going to break out
to the upside and signal the near-term bullish scenario, but it then
reversed course and ended the day with a small loss.
The NASDAQ100 Index (NDX), the other senior US stock index and the
home of the most overpriced and overbought large-cap stocks, has already
traded above its March high, although it hasn't yet broken out to the
upside.
At the same time, the Russell2000 SmallCap Index (RUT) remains in a
precarious position. The senior stock indices probably won't be in
imminent danger of suffering large declines until RUT breaks below support
at 1340, but at the close of trading on Wednesday 5th April RUT was within
1% of this support.
In the latest Weekly Update, we wrote:
"We haven't yet
exited the short-term US-stock-market-related bearish speculations in our
account, but we plan to do so over the coming few days and will then await
a new set-up."
And:
"...we are maintaining all
commodity-related bearish option positions, because there is evidence that
commodity-related equities are rolling over to the downside and because
these options are hedging our long exposure. In fact, if XME (the Metals
and Mining ETF) strengthens over the days ahead then we might take the
opportunity to add to our existing insurance via some June-2017 XME put
options."
This is to confirm that over the first three days of
this week we exited the short-term US-stock-market-related bearish
speculations (VIX call options, to be specific) in our account and added
to our commodity-related insurance via the purchase of June-2017 $27 XME
put options. These XME put options and our EEM put options serve a dual
purpose in that they are hedges against short-term downside risk in
commodity-related equities and would also likely gain a lot of value if
the senior US stock indices were to tumble within the next several weeks.
Gold and the Dollar
Gold
In
the latest Weekly Update, we wrote:
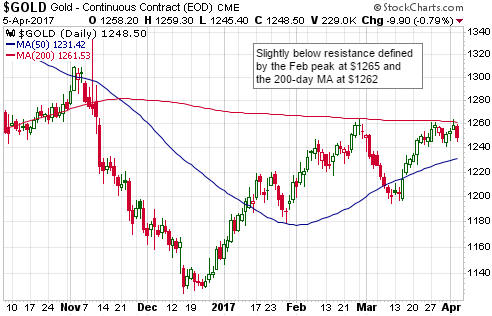
"A rise to new highs for
the year is a realistic near-term possibility and will remain so as long
as pullbacks hold above $1220, but a rise to new highs for the year will
almost certainly prove to be short-lived unless it is confirmed by the
gold-mining sector."
Gold traded in a narrow range slightly
below its February peak during the first three days of this week, so there
is no change worth mentioning.
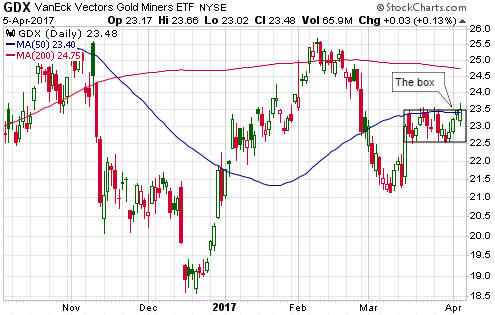
Gold Stocks
GDX (the Gold Miners ETF) has risen for four days in a row and has
achieved two marginal closes above its 50-day MA, but it hasn't yet broken
out to the upside. Instead, it has just risen from the bottom to the top
of the 'box' in which it has been confined for the past 15 trading days. A
solid daily close above $23.50 would constitute an upside breakout.
We mentioned in the latest Weekly Update that greater volatility lies
around the next corner. With regard to GDX, the greater volatility is
expected to take one of these forms:
1) A break above $23.50
followed by a quick move up to near the February peak and then a
multi-week decline to the December-2016 low (or lower).
2) The same
as above, except skipping the quick move up to near the February peak.
That's what we expect, but it's important not to be married to any
particular short-term outlook. For example, if GDX breaks above the top of
'the box' in the near future we won't blindly assume that the up-move will
fail at or below the February peak. That's what we perceive to be the most
likely outcome at this time, but we acknowledge the possibility that the
overall financial-market backdrop could quickly become very supportive for
gold and the associated mining stocks. We will therefore remain open to
evidence that our current gold-mining-related cautiousness is unwarranted.
The Currency Market
Although we didn't think
it had significant additional upside potential, after the Australian
Dollar (A$) rose to near resistance at 77.5 in March we thought that it
would break out to the upside. Instead, the aforementioned resistance
survived yet another challenge and the A$ has since pulled back to near
support at 75. If support at 75 gives way then the May and December-2016
lows in the 71-72 range will become reasonable short-term targets.
Our guess is that support in the 71-72 range will be tested this quarter.
Updates on Stock Selections
Notes: 1) To review the complete list of current TSI stock selections, logon at
http://www.speculative-investor.com/new/market_logon.asp
and then click on "Stock Selections" in the menu. When at the Stock
Selections page, click on a stock's symbol to bring-up an archive of
our comments on the stock in question. 2) The Small Stock Watch List is
located at http://www.speculative-investor.com/new/smallstockwatch.html
![]() Company
news/developments:
Company
news/developments:
[Note: AISC = All-In Sustaining Cost,
FS = Feasibility Study, FY = Financial Year, IRR = Internal Rate of
Return, ISR = In-Situ Recovery, MD&A = Management Discussion and Analysis,
M&I = Measured and Indicated, NAV = Net Asset Value, NPV(X%) = Net Present
Value using a discount rate of X%, P&P = Proven and Probable, PEA =
Preliminary Economic Assessment, PFS = Pre-Feasibility Study]
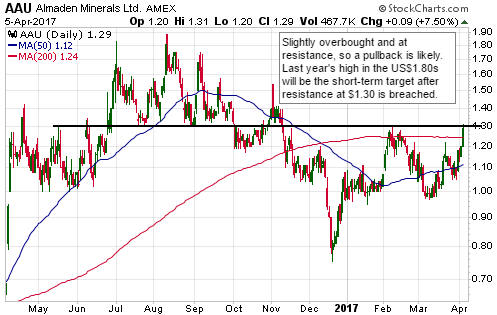
*After the close of trading on Monday, Almaden Minerals (AAU)
published the much-anticipated (by us) results of the PFS for the Ixtaca
(a.k.a. Tuligtic) gold-silver project in Puebla State, Mexico. Due to
expected time constraints later this week and the importance of the news
we are covering the PFS now rather than waiting for the Weekly Update.
The table inserted below outlines the most salient details of the PFS,
but it's worth highlighting the following:
1. At gold and silver
prices of $1250/oz and $18/oz, resp., the after-tax NPV(5%) is US$310M and
the after-tax IRR is 41%. This means that the economics of the project are
robust at current metal prices.
2. At gold and silver prices of
$1150/oz and $16/oz, resp., the after-tax IRR is still a healthy 28%.
3. The production, resource and reserve figures quoted in the table
are gold-equivalent using a gold/silver ratio of 70, but the reserves and
production are roughly 50% silver and 50% gold. In other words, this is a
silver project as much as a gold project.
4. The bottom line of
the table shows our favourite measure of the extent to which a
single-project exploration-stage mining company is over/under-valued. It
is the EVCC/NPV ratio, or the company's enterprise value plus the
estimated cost of building a mine divided by the mine's estimated net
present value. The lower the EVCC/NPV ratio, the better the value.
What we consider to be attractive value is indicated by an EVCC/NPV ratio
of 1.0 or lower. In AAU's case, based on the figures in the just-released
PFS and the current stock price the ratio is 0.74. This is extremely low
in the current market environment, especially for a stock listed in North
America (junior and mid-tier mining companies listed in Canada and/or the
US tend to be expensive relative to similar companies listed in
Australia).
That AAU is very under-valued is evidenced by the fact
that its stock price would have to rise to US$2.20 just to get the
EVCC/NPV ratio up to 1.0. In other words, AAU would still offer good value
at the current gold price at 70% above its current stock price.
Almaden Minerals
(AAU)
Project Name
Ixtaca
Location
Mexico
Engineering Study
/ Date
PFS, Apr-2017
Planned Mine Type
Open Pit
M&I Resource (oz)
3.5M
Avg Resource
Grade
1.2g/t Au-eq
P&P Reserve (oz)
2.4M Au-eq
Metallurgical
Recovery
90%
Strip Ratio
2:1
Avg Annual
Production (oz)
168K Au-eq, first 9 years
Cash Cost (per
oz)
$706
All-In Cost (per
oz)
$862
Mine Life
13 years
Initial Capital
Cost ($M)
117
Assumed Gold
Price (US$)
1250 for gold, 18 for silver
After-Tax NPV5%
($M)
310
IRR
41.0%
Capital Payback
Period
2.2 years
Project Ownership
Percent
100%
NPV of Company
Stake ($M)
310
Current Stock
Price (US$)
1.29
Share Count (M)
90
Current Market
Cap ($M)
116
Net Cash ($M)
5
Current
Enterprise Value ($M)
111
EV/NPV
36%
Current Discount
to NPV
64%
EV + Capital Cost
(EVCC)
228
EVCC/NPV
0.74
AAU will soon begin work on the Ixtaca project's FS, but it's a
near-certainty that the FS will confirm the positive economics indicated
by the PFS. The main risk now is permitting.
Applications for the
mine permits are presently scheduled to be submitted during the third
quarter of this year. AAU's management is quietly confident of getting the
necessary approvals, but the government authorities in charge of such
matters can be fickle. Mine permitting should therefore never be taken for
granted, even when the environmental engineering has been completed to a
high standard and the local community is in favour of a mine being built.
We are confident that the long-term plan for AAU does NOT involve
putting the Ixtaca project into production. AAU's senior managers are
explorers and prospect generators, not mine builders and operators.
Instead, the long-term plan for AAU would involve a sale of the company to
a mid-tier gold or silver miner such as Fortuna Silver (FVI.TO), First
Majestic Silver (FR.TO), Endeavour Silver (EXK) or Coeur Mining (CDE).
The most likely time for a takeover bid is shortly after the mine
permits have been granted.
*Blackham Resources (BLK.AX) reported on
Monday the bad news that had been flagged by last week's trading halt. The
news was very bad and will be covered in the Weekly Update. In today's
report we just wanted to quickly address the question: Is BLK a buy at its
newly-discounted price?
There's no definitive answer, because it
depends on your existing exposure to the gold-mining sector in general and
BLK in particular. It also depends on your risk tolerance. BLK is
significantly cheaper than it was a week ago, but it's also riskier. The
result is that both the risk and the potential reward have increased,
making the stock more speculative than it was.
We made a small
addition to our BLK position at A$0.40 on Wednesday 5th April, but those
with a lower risk tolerance should probably postpone new buying pending
evidence that the company's gold production is moving into line with its
mine plan.
Chart Sources
Charts appearing in today's commentary
are courtesy of:
http://stockcharts.com/index.html
![]()