|
- 05 June, 2002
Bonds,
Commodities, and Wave 2 Corrections
We are not, by any stretch of the imagination,
practitioners of Elliott Wave analysis. We do, however, appreciate the
tendency of markets to move in waves with the most common pattern being
a 5-wave sequence. In such a sequence waves 1, 3 and 5 are in the direction
of the trend whereas waves 2 and 4 are counter-trend moves or corrections.
The biggest moves usually occur during Wave 3.
We don't use Elliott wave analysis
to forecast the markets because wave patterns are always much clearer in
hindsight than they are in real time. However, we occasionally make reference
to wave counts in our commentaries because doing so can help us illustrate
what we think is happening. Furthermore, a basic understanding of the tendency
of markets to move in waves helps an investor to appreciate how mass psychology
changes during the course of a major trend. For example, the point of maximum
pessimism does not usually occur at the bottom of the downtrend. Rather,
it typically occurs near the bottom of the Wave 2 correction during the
new up-trend. Similarly, the point of maximum optimism will often occur
near the top of the Wave 2 correction in a new downtrend.
Now, let's take a look at some examples.
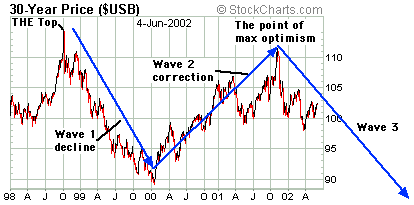
Below is a chart showing the T-Bond
price since 1998. T-Bonds reached a long-term peak in October of 1998 and
then embarked on a Wave 1 decline that bottomed in January of 2002. We
then saw a Wave 2 correction that retraced almost all of the Wave 1 decline
and peaked on 1st November last year (the day after the US Treasury told
us that future US budget surpluses were going to make the T-Bond obsolete
(Hah!!)). The failure to make a new high and the spectacular fall in the
bond price following the 1st November peak suggests that bonds are now
in the early stages of their Wave 3 decline.
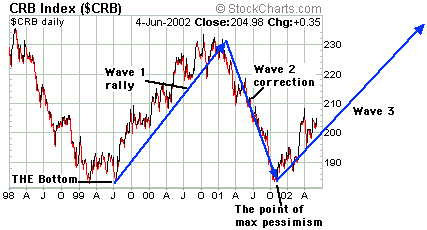
Below is a chart showing the CRB Index
since 1998. The CRB is moving in a similar pattern to bonds but with a
lag of about 2 years. Whereas bonds now appear to be in the early stages
of a Wave 3 decline the CRB appears to be in the early stages of a Wave
3 advance. Definitive technical evidence that these are, in fact, 3rd-wave
moves within major 5-wave sequences won't be available until bonds move
below their January-2000 low and the CRB moves above its October-2001 high.
However, the stock market (where we do our trading) usually rewards those
who correctly anticipate major moves, not those who react
to obvious technical breakouts.
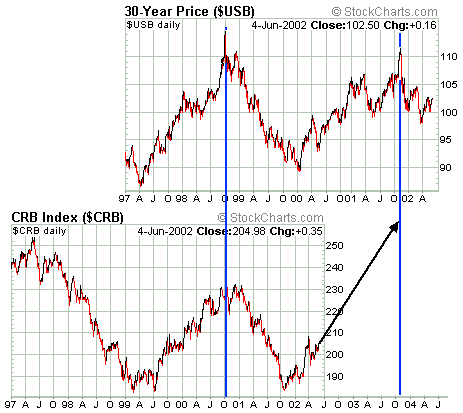
The lead/lag relationship mentioned
above between commodities and bonds can be clearly seen if we compare charts
of the CRB Index and the T-Bond and offset them by 2 years as shown below.
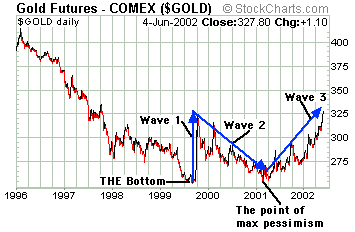
The gold market provides another good
example of a market that shows signs of being in the early stages of a
Wave 3 move (see chart below).
The US
Stock Market
2 + 2 still equals 4
The following was taken from Jim Stack's
InvesTech web site (www.investech.com):
"Something doesn't add up between
the economics of Main Street and the financial world of Wall Street. The
stock market, which normally leads and foretells the outlook for the economy,
has been heading down since mid-March. Many indexes are at 6-8 month lows.
That seems to warn of another dip back into recession for the U.S. economy.
Yet some of the most leading and
reliable economic barometers are on stable footing or moving higher - including
consumer confidence and the Purchasing Managers Survey (shown here). Monday's
release of this survey data for the manufacturing sector showed a rebound
to 55.7 -the best reading in over two years. Clearly, either these economic
barometers will experience new weakness in the months ahead... or Wall
Street's woes and concerns are overdone."
We don't want to pick on Jim Stack,
but he is bullish on the stock market and his growing sense of frustration
at the stock market's lack of response to positive economic data provides
a good example of where many stock market bulls are going wrong. One of
the reasons that today's stock market bulls are bullish is that the economy
is recovering. Conversely, almost all stock market bears are bearish on
the economy and have found reasons to doubt the generally bullish economic
data over the past 6 months. Our view differs from that of most bulls and
most bears in that, as far as this year is concerned, we are bearish
on the stock market whilst being bullish on the economy.
Rather than wondering if Wall Street's
concerns are overdone or if the economic barometers are going to experience
new weakness in the months ahead Mr Stack would do better to pose the following
questions:
1. Is it reasonable to expect a stock
that is twice as expensive as it should be to become even more expensive
just because the economy returns to a moderate growth path?
2. Is it reasonable to expect stocks
that are already over-priced to become more over-priced in a rising interest
rate environment, that is, in an environment where price/earnings ratios
will tend to contract?
3. Why should this month's reading
of 55.7 for the Purchasing Managers' Survey cause investors to pay substantially
more for stocks than they were prepared to pay during the many other times
over the past 35 years when the survey result was at this level or higher?
The major problem faced by the stock
market - the main reason that the senior stock indices continue to sink
in the face of bullish economic data - can be quickly recognised by doing
a valuation analysis of almost any of the large-cap tech stocks. For example,
let's take a look at Intel. Intel should benefit greatly from a strengthening
economy since it is, in effect, a commodity-cyclical company (the computer
chips Intel produces are 'new age' commodities). The problem is - and this
is the problem faced by the entire market - Intel is selling at twice its
historic price/sales ratio.
'Old age' commodities, however, are
quite cheap (in CPI-adjusted terms many commodities are selling near their
lowest levels of the past 80 years). So, there is every reason to expect
a strengthening economy, even if the strength is only nominal, to result
in considerably higher prices for 'old age' commodities such as copper.
In summary, it's all a matter of valuation.
The bullish analysts who expect an improving economy to push the major
stock indices higher will continue to be disappointed because these indices
are still heavily influenced by the leaders of the last bull market. And,
in most cases, the leaders of the last bull market remain very expensive.
The best the bulls can reasonably hope for is that the improving economic
backdrop will limit the downside. Then again, if the stock prices of Intel,
Microsoft, et al, get cut in half over the next few months then we really
could have an excellent set-up for a bull market.
Current Market Situation
There is no change to our short-term
view. The market is edging higher and we wouldn't be surprised to see it
maintain an upward bias for another week or so, after which the downtrend
is likely to resume. At this stage we plan to use any significant strength
over the next week to add to medium-term bearish positions.
Gold and
the Dollar
The Rand Gold Price
The last time we looked at the gold
price in terms of the SA Rand was in the 21st November 2001 Interim Update.
At that time we concluded as follows:
"...although we expect the Rand's
depreciation to enable some of the SA gold mining companies to report substantial
increases in earnings for the current quarter, thus minimising downside
risk in the stock prices, by far the biggest influence on the stock prices
of all major gold producers is the US$ gold price. For example, the Rand
gold price has been in a strong uptrend since mid-1999 and yet the SA gold
stocks trended lower throughout much of last year [2000]. They bottomed
and turned higher in November 2000 along with the US$ gold price and most
North American gold stocks. It is a similar story with the Australian gold
stocks. Although the earnings of the Australian gold miners may be more
directly tied to the A$ gold price, the Aussie gold stocks usually only
rally in response to (or in the expectation of) a rally in the US$ gold
price.
In summary, it is only at those
times when the US$ gold price is expected to rally that we get significant
upside in the stock prices of the South African and Australian gold producers.
This tells us that the stock prices of gold-producing companies are
determined more by confidence in the US$ than by company earnings."
Below is a 2-year chart of the Rand
gold price. Due to a strengthening Rand the gold price, from the perspective
of South African investors and gold producers, has been trending lower
for the past 6 months. Over the same period the shares of the unhedged
SA gold producers have made spectacular gains. This is evidence that the
US$ gold price, not the gold price in local currency terms, is the most
important driver of gold stock prices. It also reflects the influence of
foreign investors on the prices of SA gold stocks (investors in North America
and Europe seeking to take advantage of a weakening US$ can do so by buying
SA gold stocks).
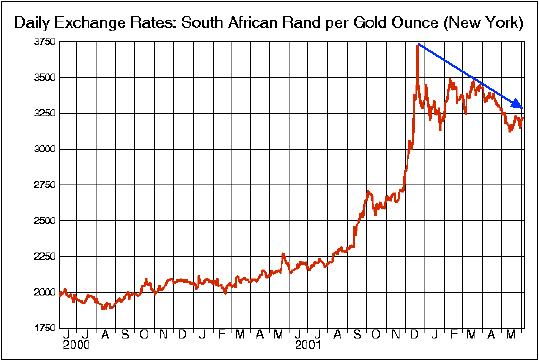
If the Rand continues to strengthen
it will limit the future earnings growth of the SA gold producers, but
a stronger Rand presents a much lower risk than would a substantially weaker
Rand. Continuing strength in the Rand will encourage additional foreign
investment in South Africa. It will also tend to put downward pressure
on local prices and, hence, on local interest rates. By contributing to
economic stability a stronger Rand might also contribute to political stability.
As such, we are not at all concerned with the negative effect that continued
Rand strength would have on the earnings of our SA gold producers.
Current Market Situation
It is estimated that the BOJ has spent
$25B buying dollars over the past 2 weeks in an attempt to strengthen the
US$ against the Yen. This massive intervention has temporarily halted the
Yen's advance but has not altered the short-term trend. This is an interesting
battle since there are no objective limits on the amount of money that
can be printed by a central bank, that is, there are no limits on the amount
of Yen the BOJ can sell in its efforts to support the US$.
The Reserve bank of Australia hiked
official interest rates by 0.25% earlier this week, the second official
rate hike in Australia over the past 2 months. As more and more central
banks around the world raise short-term interest rates to rein-in inflation
while the Fed keeps US rates at multi-decade lows because, as everyone
knows, there is no inflation in the US (snicker, snicker), the downward
pressure on the US$ will continue to increase.
Below is a daily chart of June gold
futures showing the 18-day, 50-day and 200-day moving averages. Although
Wednesday's $7 drop seemed rather dramatic the price has not yet fallen
to even the 18-DMA.
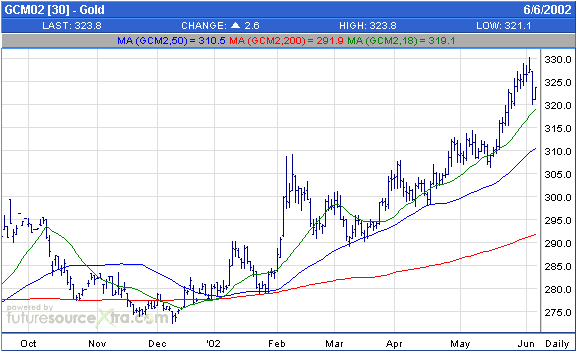
With a lot of weak-handed 'longs' having
taken positions in gold futures and gold shares over the past 2 months
the risk of a sharp pullback in the prices of the shares and the bullion
had become very high. The major unhedged SA gold shares reversed lower
at the beginning of last week while some gold stocks actually made new
highs on Tuesday before reversing course. Yesterday's drop in the gold
price was apparently initiated by someone dumping several thousand contracts
onto the market during the thinly-traded after-hours session. This action
on the part of one aggressive seller was clearly carried out with the intention
of knocking the price down, rather than getting the best price, but it
should be noted that the ploy was only effective because the market was
dramatically overbought.
If this is the bull market we think
it is then the gold price will find support at or above its 50-DMA (currently
at $310.50). There is more downside risk in the gold shares than in the
bullion because stock prices, in many cases, had already moved up in anticipation
of a $350-$400 gold price.
At this stage we don't know how long
or how deep the correction in gold stock prices will be. Based on what
we think is going to happen in the currency and stock markets (we expect
any counter-trend rallies in stocks and the Dollar to be short-lived) it
could well be over within the next week or so. The worst case (for the
bulls) that we can envisage would be a 2-3 month correction. At a similar
stage of the 1972-1974 gold-stock bull market the average gold stock fell
by 30%-40% over a 2-3 month period before climbing almost vertically over
the ensuing 3 months.
For those who have not yet built-up
a sizeable position in gold stocks this pullback is a god-send. We suggest
averaging-in to some of the high-quality gold and silver stocks (eg, HGMCY
and SIL) on weakness and building positions in a few of the more speculative
issues as the opportunities present themselves. Many of the small stocks
are extremely volatile so one way to approach this 'building' process is
to place some bids well under the market in the hope of getting 'hit' during
an emotional selling squall. Here are some suggestions (the first number
is our suggested under-the-market bid price and the number in brackets
is Wednesday's closing price). Note that the less exposure you currently
have to gold and silver stocks the less stingy you can afford to be with
any new buying.
Cumberland Resources, CBD.TO, C$2.50
(2.80)
American Bonanza, BZA.V, C$0.14 (0.18)
Western Copper, WTC.TO, C$1.90 (2.62)
Croesus Mining, CRS.AX, A$0.75 (0.83)
RSG options, RSGO.AX, A$0.25 (0.30)
Dundee Precious Metals Fund warrants*,
DPM.WT.A, C$2.00 (3.15)
*Go to http://www.etfconnect.com/select/fundPages/sectors.asp?MFID=3729
for details on the Dundee PM Fund. The warrants have a strike price of
$25 and an expiry date of Feb-2004.
Update
on Stock Selections
BHP Billiton has recently been weak
due to a hike in the UK petroleum tax, a strike at BHP Steel and rises
in both the A$ and the Rand (a lot of BHP's costs are denominated in A$
and Rand whereas it generates US$ revenue). The tax hike and the strike
are short-term issues. Strength in the A$ and the Rand is, we think, the
beginning of a longer-term trend that is based on the emerging bull market
in commodities. If this is the case then the market should soon stop worrying
about the hit to this year's earnings due to unfavourable exchange rate
movements and start focusing on the boost to earnings due to rising commodity
prices. We think BHP is a strong buy near current levels for investors
with a 12-18 month investment timeframe.
The Gold Fields Ltd (GFI) stock price
has recently been very weak (the price has dropped 25% since the beginning
of last week). It has fallen to its 50-DMA and should find support near
current levels.

|
