|
- Interim Update 5th July 2006
Copyright
Reminder
The commentaries that appear at TSI
may not be distributed, in full or in part, without our written permission.
In particular, please note that the posting of extracts from TSI commentaries
at other web sites or providing links to TSI commentaries at other web
sites (for example, at discussion boards) without our written permission
is prohibited.
We reserve the right to immediately
terminate the subscription of any TSI subscriber who distributes the TSI
commentaries without our written permission.
Update on the Shanghai move
We're now in Shanghai, but it's taking longer than expected to set up
the new house and office. Even though we've been living in China for
about 2 years we still get surprised by how long it takes to get things
done when any sort of bureaucracy -- government or private -- is
involved. Simple tasks that should really take less than an hour, like
arranging furniture deliveries and applying for satellite TV
connections, can take more than half a day. As a result, I'll probably
be living in and working out of a hotel room for a few days longer than
originally intended.
At this stage it looks like we won't be settled into our new 'digs'
until mid next week. However, the TSI publishing schedule shouldn't be
affected in a major way.
Energy
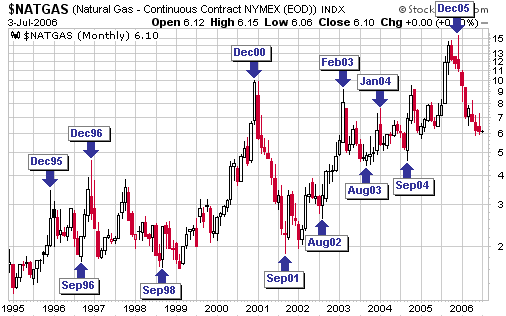
Natural Gas Cycles
We've endeavoured to show, via the following monthly chart, that
natural gas has a strong tendency to peak during December-February
(usually December) and bottom during August-September (usually
September). In fact, not counting the most recent peak in December of
2005 there have, over the past 10 years, been 5 intermediate-term peaks
during the December-February period and with one exception (1997) each
of these peaks was followed by an intermediate-term bottom during the
ensuing August-September period.
Therefore, with December-2005 having provided us with an
intermediate-term peak the odds are clearly in favour of natural gas
making an intermediate-term bottom in either August or September of
this year, with September being the more likely candidate.
It would be reasonable for investors who are primarily interested in
dividend income to be averaging into energy trusts that have a high
natural gas weighting right now (refer to the 19th June Weekly Update
for some stock selection ideas), but at TSI our primary focus is
capital growth. We therefore won't add energy trusts to the Stocks List
until we think the odds are decidedly in favour of their unit prices
rising by at least 20% over the coming 12 months.
Keep in mind that although the average yield of around 13% currently
offered by the energy trusts looks high compared to most other
income-producing securities, it is near its lowest levels of the past
10 years. In particular, note that the average yield provided by these
trusts was around 25% throughout much of 2001 and was around 16% during
the first half of 2003. All else remaining equal, an increase in the
average yield from 13% to 16% would require a fall of almost 20% in the
average unit price.
Peak Oil
In our opinion there is no oil supply problem that can't be solved by a
higher oil price. It's quite possible that the rate at which
conventional oil can be produced is close to a peak (the most
well-reasoned analyses we've read suggest that it is). However, there
are huge reserves of non-conventional oil -- the best example being the
oil that can be extracted from Canada's tar sands* -- and this
non-conventional oil has either already become economically viable due
to the past 3 years' increase in the oil price or will become
economically viable at a higher oil price.
Now, we've read that more energy is consumed than produced by the
process of mining oil from Canada's tar sands. This may well be true,
but it's irrelevant. What matters isn't the amount of energy consumed
versus the amount of energy produced, but, rather, the economic value
of the energy consumed versus the economic value of the energy
produced. The total supply of energy is as vast as the universe, but
the form of the energy determines its relative usefulness to us.
The fact that companies such as Suncor Energy and Canadian Oil Sands
are very profitable right now tells us that the economic value of the
energy produced by the large tar-sands oil projects is, at the current
oil price, substantially more than the economic value of the energy
consumed. And as the oil price rises further more oil sands projects
will become economically viable. On the other hand, the economic value
of the energy consumed when ethanol is made using corn is much greater
than the economic value of the energy produced. At least, this appears
to be the case in the US because the corn-to-ethanol industry is
heavily dependant upon large government subsidies. At a much higher oil
price the process of making ethanol from corn might, however, become
economically viable.
Further to the above, if the oil price continues its long-term upward
trend, converting uneconomic reserves to economic ones in the process,
then there will be plenty of oil for many decades to come. The risk is
that the governments of the largest oil-consuming countries take steps
to limit the profitability of oil production by imposing price caps on
oil or higher taxes on the oil industry. Such steps would reduce the
ability and the incentive to invest in the development of future oil
production and could lead to a shortage where none would otherwise have
existed.
Putting it another way, the more 'obscene' the profits of the big oil
companies become the more money these companies will invest in the
development of future oil production and the more venture-capital money
will flow towards the oil industry. As a result, more oil will be
discovered/produced. This is the way of the market when it is allowed
to function freely, that is, when it is unfettered by the attempts of
politicians to appear helpful.
*When the oil contained within tar sands is taken into account, Canada's oil reserves are greater than those of Saudi Arabia.
Bonds
A big change in market structure
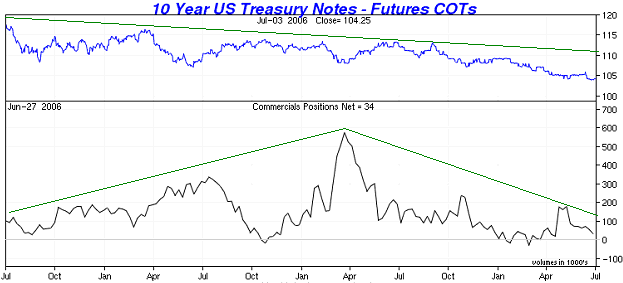
The top part of the following chart shows the price of the US 10-year
Treasury Note and the bottom part shows the net position of Commercial
traders in T-Note futures. Our purpose in including this chart is to
highlight the major change in the behaviour of Commercial traders --
the so-called "smart money" -- over the past year.
US Treasury Notes have been in a bear market since June of 2003, but
during the first 21 months of this bear market the Commercials bought
aggressively in response to every significant price decline and became
increasingly 'long' the market (as indicated, on the following chart,
by the rising peaks in the Commercial net position). However, since
hitting an all-time high in March of 2005 the Commercial net-long
position has been in a steep downward trend despite the fact that the
T-Note price has continued to trend lower. For example, the May-2006
low in the T-Note price was well below the March-2005 low, but whereas
the Commercials were net-long to the tune of almost 600,000 contracts
at the March-2005 bottom they were net-long by less than 200,000
contracts at the May-2006 bottom. And now, with T-Note futures having
pulled back to near their May-2006 bottom the Commercials are net-long
by only 34,000 contracts.
The Commercial position in any futures market will always be offset by
an equal and opposite speculative position. So what we had during the
first 21 months of the bond bear market was speculators building up
huge short positions in response to price weakness, which, in turn,
made the market acutely vulnerable to short-covering and made it
difficult for a substantial price decline to occur. But this
short-covering fuel is no longer present because speculators, as a
group, are now almost net-flat despite the fact that T-Notes recently
hit new multi-year lows.
The bottom line is that the structure of the bond market is consistent with our short- and intermediate-term bearish outlooks.
Current Market Situation
10-year T-Note futures have already breached their May low, but 30-year
T-Bond futures are in a different situation. As illustrated by the
following chart, September T-Bond futures are still slightly above
important support defined by the May-2006 low.
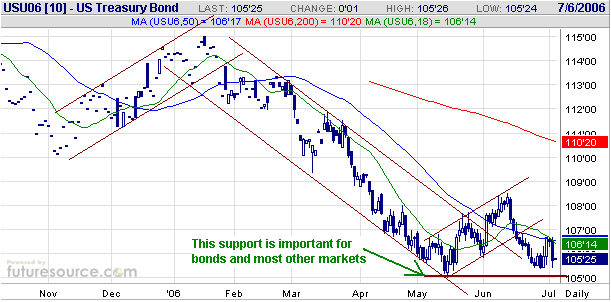
Wednesday's decline in the stock market was widely attributed to North
Korea's missile tests, but if the missile tests were the real cause of
the stock market's weakness then the bond market should have caught a
'flight to safety' bid. However, bonds fell sharply on Wednesday and
ended the session only marginally above critical support. In our
opinion, it was the weakness in the bond market that drove the stock
market downward on Wednesday, not fears related to North Korea.
We expect that bonds will break below the May-2006 low as well as the
August-2003 low within the next few months, but have no opinion as to
whether the breakdown will occur immediately or following another
modest rebound. If/when the breakdown does occur it will likely have a
strong adverse effect on the stock market, the commodity market, and,
perhaps, the gold market. Beyond the short-term a breakdown in the bond
market would be bullish for gold to the extent that it caused the
yield-spread to widen, but with gold and the stock market presently
moving up and down together the gold market might initially react
negatively to a breakdown in bonds.
The Stock Market
Current Market Situation
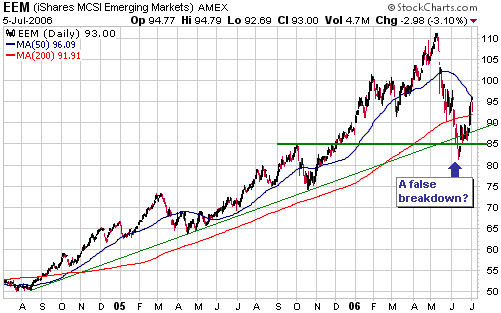
From a technical perspective iShares MSCI Emerging Markets (AMEX: EEM),
despite having experienced a quick peak-to-trough decline of 27% during
the May-June global stock market correction, still appears to be in
reasonable shape. As illustrated by the following chart, although
important support was breached during the first half of June the stock
has since rebounded smartly enough to make the June breakdown look like
a 'head fake'.
The picture painted
by the above EEM chart is consistent with what we are seeing in
numerous other stock market charts. It's a picture that supports
neither a short-term bearish view nor a short-term bullish view.
Our view continues to be that the most likely scenario entails a choppy
rebound over the coming 2-3 months followed by a resumption of the
downtrend.
Gold and
the Dollar
The US$
We'd be skeptical of any gains made by the Dollar Index in response to
stronger-than-expected US economic data because leading indicators tell
us that the US economy is going to be materially weaker over the next
6-12 months than it has been over the past 6 months. That is, gains
made by the dollar on the back of positive economic news are likely to
be short-lived.
The reason to be bullish on the dollar is the US currency's REAL
interest rate advantage, and with central banks throughout the world
frightened to change nominal short-term interest rates by more than
0.25% every couple of months the main drivers of real interest rate
differentials over the next several months will be changes in inflation
expectations. As such, slower economic growth in the US might actually
be a positive for the dollar by lowering inflation expectations and, as
a consequence, pushing the real interest rate upward.
On a side note, under the current monetary system slower economic
growth will eventually lead to higher inflation due to the Fed's
attempts to counteract the slowing growth. However, reduced inflation
EXPECTATIONS will often be the initial effect of a slowdown in growth
because most people wrongly associate stronger growth with higher
inflation.
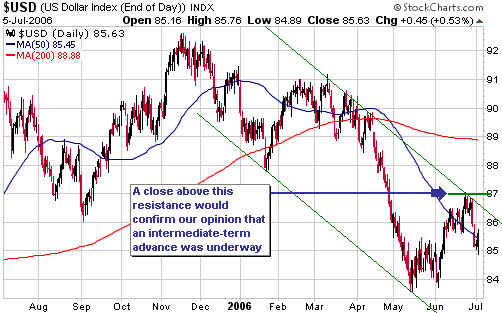
The current market situation is shown on the following daily chart. The
Dollar Index rebounded for about 5 weeks following its May-2006 low and
then reversed lower after reaching the top of a downward-sloping
channel. Based on the way the bottoming process unfolded during the
first quarter of 2005 our expectation is for some consolidation over
the coming few weeks followed by a multi-month dollar advance.
Gold Stocks
Current Market Situation
Below is a daily chart of the AMEX Gold BUGS Index (HUI).
We suspect that the HUI's initial rebound from its June low has ended
and that a multi-week pullback has begun. We don't, however, have a
firm opinion on the likely depth of the anticipated pullback. It's
possible, for example, that the HUI will fall far enough over the next
few weeks to test its June low, but it is also possible that any
pullback at this time will be shallow (5-10%).
A lot depends on what happens with the broad stock market because over
the past year the major gold stocks have, in effect, been high-beta
plays on the senior stock indices (the HUI has risen by more than the
S&P500 Index during stock market rallies and fallen by more during
stock market corrections). It would therefore be likely for stability
in the broad stock market to coincide with a shallow pullback in the
gold sector and for a decisive break to new lows by the S&P500
Index to lead to a full test of the HUI's June low.
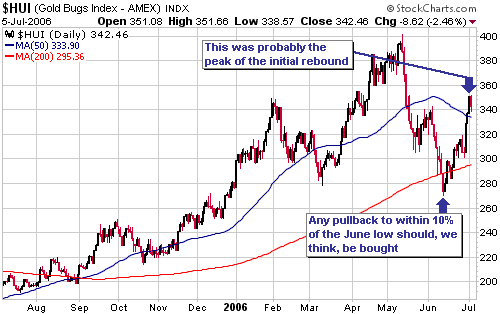
Profit Taking
As mentioned above, we think the HUI has commenced, or is about to
commence, a pullback. We don't, however, see this as a particularly
good profit-taking opportunity and haven't done any selling in our own
account in anticipation of this pullback (although we almost certainly
will do some selling if the HUI defies our expectations and gains
another 10% or so over the coming few weeks). This is because we
generally don't try to catch short-term moves, but, instead, make
buy/sell decisions based on the expected outcome over the coming year.
For those with more of a short-term trading approach, some profits could be taken on the major gold stocks at this time.
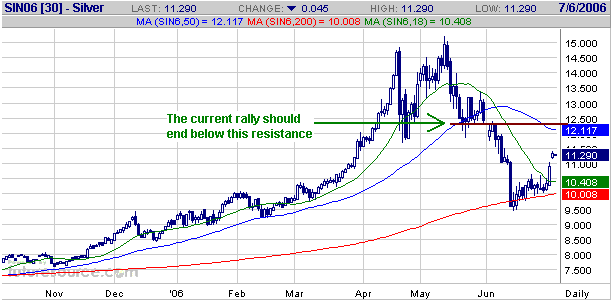
Silver
Over the past 3 months we've had $8.50 in mind as a downside target for
silver, but in order for this target to remain viable the current
rebound should not take the price above the resistance shown on the
following chart. Putting it another way, if this resistance is breached
then the June low will probably turn out to be the ultimate correction
low.
The most likely outcome, in our opinion, is that the current rebound
ends in the $11-$12 range and is followed by a decline that takes
silver below its June low. However, attempting to buy the bottom or
sell the top is a 'mugs game'. Therefore and as noted a few times
during the May-June correction, we'd be buyers of silver at prices
below $10. If you end up doing most of your buying within 15% of
intermediate-term lows within long-term bull markets you will be
positioned to achieve excellent returns.
Update
on Stock Selections
(Note: To review the complete list of current TSI stock selections, logon at http://www.speculative-investor.com/new/market_logon.asp
and then click on "Stock Selections" in the menu. When at the Stock
Selections page, click on a stock's symbol to bring-up an archive of our comments on the stock in question)
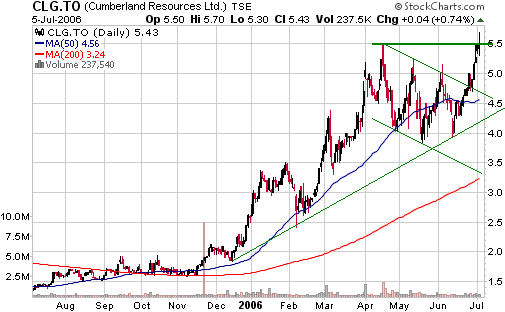
 Cumberland
Resources (TSX and AMEX: CLG) owns the Meadowbank gold project in the
Nunavut region of Canada. The project has a gold reserve of 2.9M ounces
and a measured-and-indicated (M&I) resource of 3.8M ounces. If
environmental permits are obtained as planned within the next few
months then the construction of a 330K-ounce/year mine will begin with
initial production likely to occur during 2008 or 2009. Cumberland
Resources (TSX and AMEX: CLG) owns the Meadowbank gold project in the
Nunavut region of Canada. The project has a gold reserve of 2.9M ounces
and a measured-and-indicated (M&I) resource of 3.8M ounces. If
environmental permits are obtained as planned within the next few
months then the construction of a 330K-ounce/year mine will begin with
initial production likely to occur during 2008 or 2009.
We suspect that CLG will be purchased by one of the major gold mining
companies later this year if it is successful in obtaining the permits
required to commence mine construction. The likelihood of such a
buy-out provides upside potential, as does the likelihood of additional
gains in the gold price over the coming 12 months. However, there is a
small risk that the required permits won't be received and the
remoteness of the project's location could create some problems once
construction gets underway. These risks wouldn't be major concerns to
us if CLG were still priced at bargain-basement levels, but as a result
of the stock's good performance the company now has a relatively high
market cap taking into account the risks and the estimated US$225M
capital cost of the proposed mine. In particular, adding the capital
cost to CLG's current market cap and subtracting the company's US$25M
of cash gives us an adjusted market cap of US$480M, which equates to
US$126 per M&I ounce. This, in turn, is high relative to many other
development-stage companies.
Technically, the stock looks fine (see chart below). However, due to
its relatively high valuation CLG's intermediate-term risk/reward ratio
is no longer attractive enough to warrant its on-going inclusion in the
TSI Stocks List. We will therefore remove it from the List and record a
profit of 131% based on our September-2002 entry at C$2.35 and
Wednesday's closing price of C$5.43.
Investors who are
exiting CLG could consider investing the proceeds of the sale in
Metallica Resources (AMEX: MRB) and Sabina Silver (TSXV: SBB). SBB's
Hackett River project is in the same part of the world as CLG's
Meadowbank project, but SBB has a far more interesting risk/reward
ratio than CLG. SBB is riskier, due mainly to its project being at a
much earlier stage of development, but offers a much greater potential
reward. MRB, on the other hand, appears to have less risk than CLG as
well as greater upside potential.
Chart Sources
Charts appearing in today's commentary
are courtesy of:
http://stockcharts.com/index.html
http://www.futuresource.com/

|