![]()
![]()
![]()
![]()
- Interim Update 5th July 2017
Copyright
Reminder
The commentaries that appear at TSI
may not be distributed, in full or in part, without our written permission.
In particular, please note that the posting of extracts from TSI commentaries
at other web sites or providing links to TSI commentaries at other web
sites (for example, at discussion boards) without our written permission
is prohibited.
We reserve the right to immediately
terminate the subscription of any TSI subscriber who distributes the TSI
commentaries without our written permission.
US Recession Watch
In many endeavours including the
field of financial-market speculation there's an optimum amount of
information. Once this optimum is reached, getting more information
'muddies the waters' and reduces the likelihood of arriving at the correct
conclusion. For example, when trying to come up with a realistic estimate
of the earliest time that the US economy could enter its next recession
the optimum amount of information encompasses only three indicators: the
monthly ISM Manufacturing New Orders Index (NOI), the quarterly Real Gross
Private Domestic Investment (RGPDI) calculation, and the
constantly-updating yield curve. Taking into account any other economic
indicators/statistics will more likely reduce than enhance the ability to
correctly estimate.
The latest ISM report on US manufacturing was
issued on Monday of this week and shows that in June-2017 the NOI rose to
63.5. The relevant chart is displayed below. This means that the NOI is
near its highest level of the past 10 years, which, in turn, suggests that
the final quarter of this year is the EARLIEST time that the next US
recession could start.
Under normal circumstances there is no consistent relationship between
the performance of the US economy and the performance of the US stock
market. In particular, economic strength generally does not imply stock
market strength and economic weakness generally does not imply stock
market weakness. It is therefore generally not appropriate to base stock
market forecasts on the current or the expected future performance of the
economy. However, there is a consistent relationship between the
performance of the US economy and the performance of the US stock market
when the US economy is in recession. During periods of economic recession
the stock market is invariably weak and typically loses at least 30% of
its value.
That's why, from a practical stock-market speculation
standpoint, the only economic statistics we care about are the ones that
have good long-term records as leading indicators of recession.
The Stock Market
The US
The NASDAQ100 Index (NDX) broke below support near 5650 on Monday and then
returned to the breakout level on Wednesday (the market was closed on
Tuesday).
From our bearish perspective the ideal would be for the
NDX to immediately resume its decline, thus marking Wednesday's rally as a
successful test of Monday's downside breakout. However, a move up to
5700-5750 within the next three trading days wouldn't change anything.
In the latest Weekly Update, we wrote:
"...over the past
three weeks and especially over the past week there have been signs of
another shift in speculative focus. It's too soon to know if this shift in
focus will stick, but inflation expectations have turned upward and
stock-market inflation plays have begun to demonstrate relative strength.
By stock-market inflation plays we are referring to the stocks of
companies that are perceived to benefit from rising long-term interest
rates and rising prices for basic materials. The stocks of banks,
industrial-metal mining companies and steel manufacturers are examples."
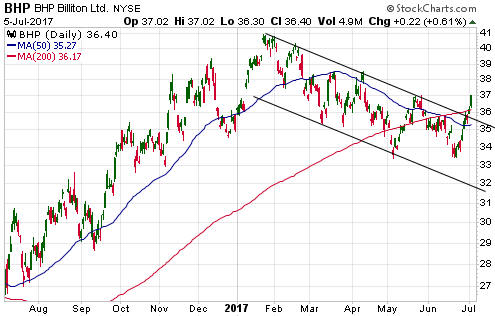
The shift in speculative focus continued this week, as exemplified by
the following chart. The chart shows that BHP, a very large and
diversified producer of industrial commodities, has broken above the top
of the channel that defined its progress during the first half of the
year.
The stocks of transportation companies also qualify as stock-market
inflation plays and they, too, have begun to outperform. In fact, when the
NDX broke below short-term support on Monday of this week the Dow
Transportation Average (TRAN), which had been relatively weak for the bulk
of the preceding 6 months, made a new high for the year (a new all-time
high).
It makes sense to be on the lookout for opportunities to bet against
the NDX and add exposure to industrial commodities.
Gold and the Dollar
Gold
In
the latest Weekly Update, we wrote:
"With regard to the likely
performance of the US$ gold price over the next couple of weeks we think
it is an even-money bet as to whether there is a break above the 50-day MA
and a rise to around $1270 or a break below the 200-day MA and a drop to
support at $1215-$1220."
The market ended up doing the latter,
that is, the US$ gold price broke below its 200-day MA and dropped to
support at $1215-$1220.
There doesn't need to be, and there often isn't, a fundamental reason
for a $20 (roughly 1.5%) change in the gold price, although it isn't hard
to find a fundamental reason for Monday's $20 price decline. The reason is
linked to this excerpt from the latest Weekly Update:
"Last
week's shift in the GTFM [to slightly bearish] was solely due to a rise in
the real interest rate (the 10-year TIPS yield), but the "relative
strength of the banking sector" component is now right on the edge. Any
additional strength from here in the BKX relative to the SPX will change
this component from gold-bullish to gold-bearish (relative strength in
bank stocks is indicative of rising confidence in the financial system,
which is bearish for gold) and cause the GTFM to become more decisively
bearish."
There was enough additional strength in the BKX
relative to the SPX on Monday 3rd July to cause an upside breakout in the
BKX/SPX ratio. If this breakout holds until the end of the week and there
are no other significant changes then the fundamental backdrop -- as
indicated by the GTFM -- will have become more decisively bearish for
gold.
The relative strength of the banking sector over the past
week was partly a response to the results of the Fed's latest
commercial-bank stress tests. These tests supposedly showed that large
commercial banks have abundant capital, thus paving the way for increased
dividends and stock buybacks. However, from a money-management standpoint
the reason for a shift in financial-system or economic confidence is much
less important than the simple fact that a shift occurred.
Regardless of the fundamentals, the US$ gold price is 'oversold' and close
to an important support level. Although we aren't going to bet on it, this
probably means that the stage is set for at least a 1-2 week rebound. Note
that a routine 1-2 week rebound from near Wednesday's low of $1216 would
take the price back to the $1250s. A decline to a new multi-month low
would then get underway.
The euro-denominated gold price
(gold/euro) is in a different position. Whereas the US$ gold price is
probably not yet close to a sustainable bottom, gold/euro could well be.
This year's performance to date by the euro gold price has been
similar to what we expected from the US$ gold price at the beginning of
the year. Based on our assessment of the sentiment and fundamental
backdrops late last year and early this year, we were expecting no more
than a 3-month rebound in the US$ gold price from its December-2016 low.
Of greater relevance, we expected that this rebound would be followed by a
decline to below the December-2016 low during the second or third quarter
of the year, creating an intermediate-term bottom and an excellent buying
opportunity. However, thanks to the drawn-out weakness in the US$'s
exchange rate the US$ gold price has been a little stronger than
originally expected and remains well above its December-2016 low, whereas
the euro gold price has broken below its December-2016 low and is now
trading at its lowest level in more than 12 months.
Gold/euro is
now very 'oversold' and is probably not far from an intermediate-term
bottom.
Gold Stocks
The various gold-mining indices
and ETFs are in slightly different positions on the charts. Today we'll
focus on the HUI, which has recently been the weakest index/ETF and is now
testing support defined by its March and May lows. A rebound from
Wednesday's low would create a triple bottom and triple bottoms rarely
hold for long.
A routine counter-trend rebound would likely be
capped by either the 50-day MA in the low-190s or the 200-day MA in the
high-190s.
We don't have an opinion on what will happen to the gold-mining sector
over the next two weeks, but we expect to see the HUI below its
December-2016 low within the coming three months. If so, we could get the
opportunity we've been waiting for to buy Continental Gold (CNL.TO) in the
C$2.80s and Sandstorm Gold (SAND) below US$3.00.
The
Currency Market
The following chart shows that over the
past 12 months the Dollar Index (DX) closely tracked the difference
between US government and German government 10-year bond yields. It also
shows that over the past 6 weeks the DX overshot to the downside.
To bring the DX into line with the interest-rate difference, over the next
few weeks there will probably be either a sharp rise in German bond yields
relative to US bond yields (causing a plunge in the green line on the
chart) or a sharp rebound in the DX. We think that the latter outcome is
the more likely.
EUO is a 2X-leveraged ETF that moves in the opposite direction to the
euro, meaning that it moves in the same direction as the DX. It has just
begun to rebound from an 'oversold' extreme and is a reasonable short-term
speculation provided that risk is managed via a protective stop set
slightly below the low of the past week (US$23.00).
We aren't
adding an EUO trading position to the TSI List at this time, but our own
account contains a bullish EUO bet in the form of November $25 call
options.
Updates on Stock Selections
Notes: 1) To review the complete list of current TSI stock selections, logon at
http://www.speculative-investor.com/new/market_logon.asp
and then click on "Stock Selections" in the menu. When at the Stock
Selections page, click on a stock's symbol to bring-up an archive of
our comments on the stock in question. 2) The Small Stock Watch List is
located at http://www.speculative-investor.com/new/smallstockwatch.html
![]() New
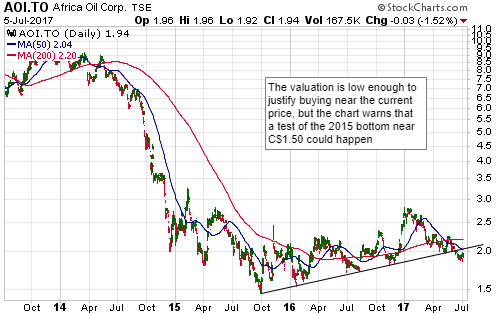
TSI Stock Selection: Africa Oil Corp. (TSX: AOI). Shares: 457M issued,
469M fully diluted. Recent price: C$1.94
New
TSI Stock Selection: Africa Oil Corp. (TSX: AOI). Shares: 457M issued,
469M fully diluted. Recent price: C$1.94
We expect that
the current rebound in the oil price will be followed by a decline to new
lows for the year, creating a better opportunity to buy oil stocks than
exists today. However, the risk/reward ratio of
Africa Oil Corp.
(AOI.TO) is attractive enough to make it a reasonable candidate for
new buying near its current price despite the likelihood of oil dropping
into the $30s within the coming three months. This is because risk is
limited by the company's huge net-cash position. It is also because
although the company's stock price generally trends in the same direction
as the oil price, the potential reward is associated more with development
success than a higher oil price.
The main asset of AOI is its 25%
stake in the South Lokichar Basin, Kenya. Its joint-venture (JV) partners
are Tullow Oil, a multi-national
UK-based oil producer with vast experience in the development of oil
fields in Africa, and the Denmark-based Maersk, one of the world's largest
companies. Tullow owns 50% of South Lokichar and is the operator of the
JV. Maersk owns the remaining 25%.
The JV's plan is for South
Lokichar to be developed into a producing oil field over the coming four
years. Part of this plan involves the government of Kenya building a
pipeline to transport the oil overland to a sea port. The pipeline is
expected to take three years to complete.
The best estimate* of
AOI's share of South Lokichar's Risked Contingent Resources (RCR) is
162mmbo (162 million barrels of oil), but this figure will grow with
additional exploration. An indication of the growth potential is the fact
that the high estimate of AOI's share of the project's Unrisked Contingent
Resources (UCR) is more than 400mmbo. This is equivalent to about 16M
ounces of gold.
Based on the current best estimate of the RCR and
using a 10% discount rate, AOI's 25% share of South Lokichar has been
calculated to have an NPV of US$1,035M. Taking into account the various
risks, including the fact that the project is probably at least 4 years
from production, for valuation purposes we apply a 50% discount to this
figure. In other words, we consider AOI's share of Lokichar to have a
current value of US$517M.
AOI has other exploration-stage oil
assets in East Africa that add to the company's overall value, but for the
sake of simplicity and to be conservative we are assigning no value to
these assets at this time.
AOI's other major asset is its cash,
including the funding that will be provided on its behalf by Maersk if the
project continues along the path to production. Specifically:
a) At
31st March the company had no long-term liabilities and US$419M of working
capital. In essence, it had net-cash of US$419M. This large cash position
is mostly due to a payment to AOI by Maersk when the Danish company bought
into the project early last year by acquiring half of AOI's 50% stake.
b) Over the course of 2018 Maersk has agreed to pay AOI a total of
US$75M via four quarterly payments of US$18.75M.
c) The sum of the
cash mentioned in a) and b) above equates to about C$1.40/share.
d)
After a final investment decision (FID) is made, Maersk will be obligated
to pay up to US$405M of AOI's development expenses.
Due to AOI's
current cash and Maersk's future obligations, there should be no need for
AOI to issue additional equity to get to production.
Getting to the
stock's valuation, here's what we come up with:
US$419M - working
capital
US$75M - 2018 payment from Maersk
US$405M - future Maersk
payments contingent upon the project moving towards production
US$517M
- 50% of the current NPV of AOI's South Lokichar stake
The total of
the above is US$1416M, or US$3.10/share (C$4.02/share at an exchange rate
of 0.77). This is approximately double the current stock price.
Despite its attractive valuation, AOI's stock could trade significantly
lower within the next few months if the oil price drops below $40/barrel.
We think there is downside risk to around C$1.50/share, but this risk is
small relative to the potential reward over the coming 1-2 years. If the
stock interests you, perhaps buy a third of or half a position now with
the aim of adding on weakness over the coming four months.
A final point worth mentioning is that AOI is sometimes promoted as
being part of the Lundin Group, but this is not really true anymore.
Lundin's stake in AOI has been whittled down over the years and is
presently no more than 5%.
*There are three
estimates of Contingent Resources: a low (pessimistic) estimate (1C), a
best estimate (2C) and a high (optimistic) estimate (3C).
 Removing FCG from the TSI Stocks List
We added the
First Trust Natural Gas ETF (FCG) to the TSI List back in July-2015 to
provide long-term exposure to natural gas and oil. It was a poorly timed
move as FCG is now about 50% lower.
With the above-discussed
addition of AOI, the TSI List now has exposure to natural gas via PRQ.TO
and exposure to oil via AOI.TO. This is as much as we want at this time.
Furthermore, both PRQ and AOI have better risk/reward ratios than FCG. We
have therefore removed FCG from the List and recorded the large loss.
Chart Sources
Charts appearing in today's commentary
are courtesy of:
http://stockcharts.com/index.html
![]()