|
- Interim Update 5th September 2007
Copyright
Reminder
The commentaries that appear at TSI
may not be distributed, in full or in part, without our written permission.
In particular, please note that the posting of extracts from TSI commentaries
at other web sites or providing links to TSI commentaries at other web
sites (for example, at discussion boards) without our written permission
is prohibited.
We reserve the right to immediately
terminate the subscription of any TSI subscriber who distributes the TSI
commentaries without our written permission.
The Stock Market
Update on the equities-Yen relationship
At TSI we've been following the strong positive correlation between the
stock market and the euro/yen exchange rate for about six months. This
remarkable relationship is now being followed by many other analysts
and newsletters so perhaps it is about to outlive its usefulness (once
a reliable relationship becomes common knowledge it will usually stop
being reliable), but as of yesterday it was still going strong.
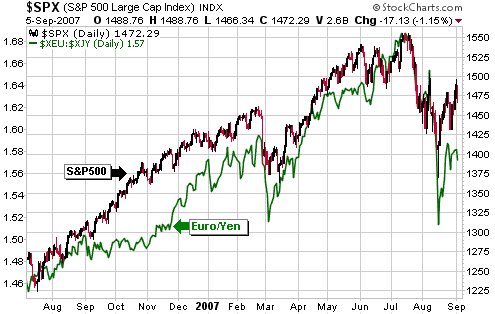
The relationship in question is depicted on the following chart. Notice
how the twists and turns of the S&P500 Index have coincided with
similar twists and turns in euro/yen, with Yen weakness relative to the
euro (a rising euro/yen) typically being accompanied by a rising stock
market and Yen strength relative to the euro (a falling euro/yen)
typically being accompanied by a stock market decline.
The charts of the
stock market and the euro/yen exchange rate are so similar it is
impossible to tell which is the leader and which is the follower. In
other words, it is impossible to tell whether Yen strength against the
euro CAUSES the stock market to decline or whether stock market
weakness causes the Yen to rise against the euro. We suspect it's a bit
of both, with stock market weakness or Yen strength prompting traders
to reduce their exposure to the Yen carry trade, which, in turn,
results in additional Yen strength and stock market weakness, and so
on.
Anyhow, if the stock market drops sharply from a rebound high during
the first half of September to an October low (our current expectation)
then the Yen will probably move to considerably higher levels over the
same period.
Two short sale candidates
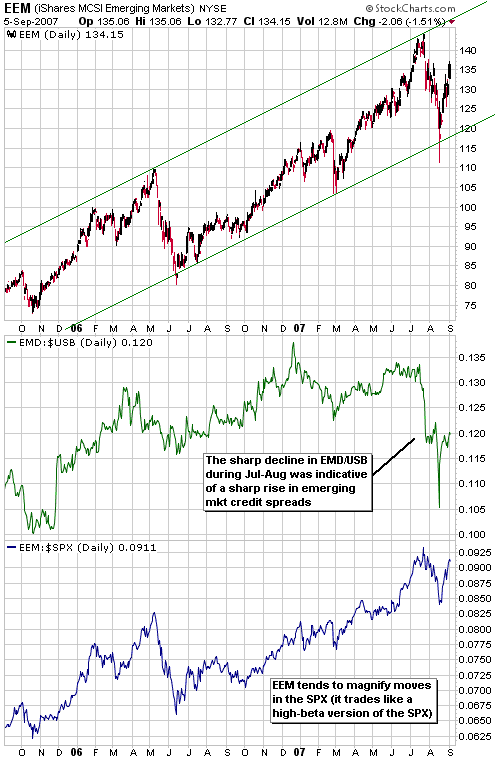
The following chart compares the Emerging Markets ETF (EEM) with the
EMD/USB ratio and the EEM/SPX ratio. The EMD/USB ratio is a proxy for
emerging market credit spreads (differences between the yields on
emerging market bonds and US Treasury bonds) and the EEM/SPX ratio
indicates how emerging market equities are performing relative to
large-cap US equities.
The top part of the chart shows that EEM momentarily fell below the
bottom of its 2-year channel in mid August before quickly recovering.
It has now retraced about 70% of its July-August decline and is back to
within about 7% of its July peak. The question is: did the correction
end in August, or was the July-August plunge from channel-top to
channel-bottom just the first leg in a larger correction?
The middle part of the chart (the EMD/USB ratio) suggests that the
July-August decline was the first leg in a larger correction. This is
because the sharp rise in emerging market credit spreads evidenced by
the plunge in the EMD/USB ratio indicates that there are more serious
underlying problems now than existed during prior corrections over the
past few years. Also, the recent recovery in emerging market credit
spreads has not been anywhere near as impressive as the concurrent
recovery in emerging market equities. (Note: EMD/USB's recent
performance overstates the amount by which the credit markets have
actually recovered).
The EEM/SPX ratio has been included at the bottom of the chart to make
the point that when EEM rises in dollar terms it also tends to gain
ground relative to the SPX, and that when it falls in dollar terms it
also tends to lose ground relative to the SPX. In other words, EEM
tends to rise faster than the SPX during rallies and then fall faster
than the SPX during the ensuing corrections.
The upshot of the above is that speculators looking for ways to bet on
further downside in global equities could consider betting against EEM,
either by shorting it into strength over the coming days or via put
options. EEM put options are too illiquid to be included as formal
recommendations in the TSI Stocks List, but either the December-2007 or
the January-2008 $110 puts would make for an interesting speculation.
Another short sale
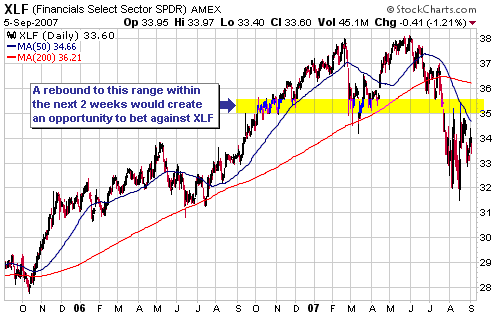
candidate is XLF, a fund whose components are banks and other large
financial companies. XLF contains the companies that are at the
epicentre of the debt crisis, so it should stay relatively weak as long
as the crisis continues.
We will add the XLF December-2007 $33.00 put options (XLFXG) to the TSI
Stocks List if they trade at US$1.25 within the coming fortnight. Note,
though, that XLF will probably have to move up to the $35.00-$35.50
resistance range highlighted on the following chart in order for the
aforementioned put options to trade as low as $1.25. That is, we will
only be betting against XLF if we get the chance to do so at a more
favourable price.
A word of caution for the bears out there
The main risk facing short-term bears is the fact that they have so
much company. For example, the following chart shows the enormous
increase in the number of shares sold short by the US public during the
July-August stock market correction. Data released over the next two
weeks will undoubtedly reveal that there has since been a substantial
decline in the number of shares sold short, but the point is that there
was a sufficient stampede towards the bearish side of the fence during
the first half of August to create a sustainable low.
Our view is that the August low will be breached during October, but probably not by a wide margin.

Gold and
the Dollar
Gold
The 'B's to the rescue!
...the
markets can be confident that the few minor actions already taken...are
gambits that will be followed by far more aggressive inflationary steps
if required. This, we suspect, is why the gold market has 'perked up'...
There's no longer any reason to worry because in speeches last Friday
the world's two most powerful 'B's -- Bush and Bernanke -- confirmed
that they were jumping in, or were prepared to jump in should the need
arise, to prevent the financial crisis from disadvantaging the average
hard-working American. Specifically, President Bush generously offered
to use other peoples' money to help financially troubled homeowners
remain in the homes they can't afford, while Bernanke assured the world
that the Fed is prepared to act as needed to limit the financial
storm's impact on the economy.
If there's one thing that can be relied upon as much as death and taxes
it's that the problems caused by government intervention in the economy
will be used to justify more government intervention in the economy. In
fact, the main way in which a government grows is by first creating
problems and then offering solutions that involve a bigger government.
Furthermore, this long-term government growth trend can be relied upon
regardless of who happens to be in power, although relatively
short-lived 'corrections' will occur during those rare times when a
critical mass of voters comes to the conclusion that any attempt to
make things better via more government spending will only make things
worse.
Bush's and Bernanke's promises to help fix what's currently ailing the
economy therefore constitute another predictable step along a well-worn
path. After all, the current problems wouldn't have emerged in the
first place if the massive Fed/Government-sponsored inflation (credit
expansion) of the past several years hadn't given birth to booms in
housing and structured finance.
And although the official response to the budding financial crisis has
been muted to date, the markets can be confident that the few minor
actions already taken -- last Friday's promises of assistance and the
17th August cut in the discount rate, to be specific -- are gambits
that will be followed by far more aggressive inflationary steps if
required. This, we suspect, is why the gold market has 'perked up' over
the past three trading days. Traders have probably increased their
exposure to gold as a result of becoming more confident that an
inflationary policy-response is imminent.
It's worth noting, at this point, that the inevitable inflationary
policy-response won't come from just the US. Rather, it is reasonable
to assume that most governments and central banks will take whatever
actions they deem necessary to perpetuate the global monetary expansion
that went into overdrive a few years ago and is now hitting some
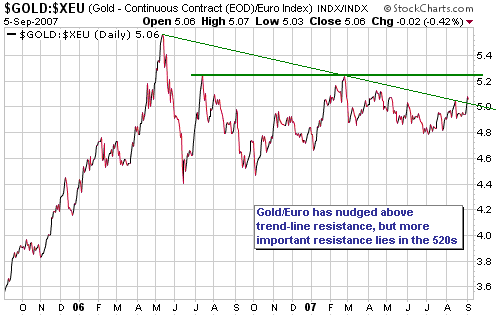
troublesome speed bumps. This is undoubtedly why gold has just 'perked
up' in terms of all the major fiat currencies, not just in terms of the
US$. For example, the following charts reveal gold's recent strength in
euro and A$ terms.

We have never had any
doubt that the current financial crisis would eventually lead to more
inflation. Moreover, it is our view that the additional damage to the
currencies of the world that will result from the upcoming attempts of
central banks to 'paper over' the mess they helped create will sow the
seeds of the next major gold rally. There is, however, a risk that gold
will be pushed significantly lower in the short-term due to a rise in
the US dollar's exchange rate combined with the initial inflationary
responses of policy-makers being somewhat cautious. In fact, the gold
price currently being within 7% of last year's peak should, in itself,
prompt some caution on the parts of various monetary authorities as
they decide how best to sustain the inflation trend.
It is the aforementioned risk that causes us to shy away from
speculative positions predicated on the US$ gold price making
significant additional gains over the coming 1-2 months.
Current Market Situation
We have been anticipating, and continue anticipate, a near-term rise by
the October gold futures contract to the $695-$710 range indicated on
the following daily chart. However, we don't think a decisive move
above $710 is likely over the coming 1-2 months.
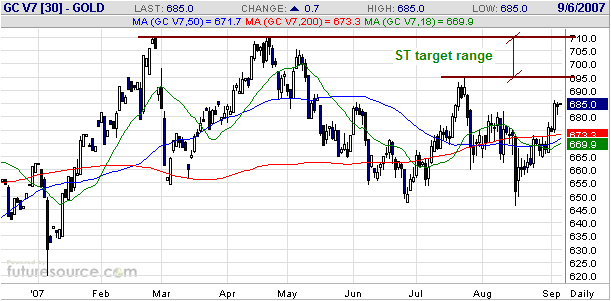
As mentioned in the
e-mail sent earlier this week, unless advised otherwise we will
downgrade our short-term gold market outlook to "bearish" if the
October contract trades above $690. If this happens it will simply be
an acknowledgement of our view that once gold moves into the 690s the
likely additional short-term upside will be materially less than the
short-term downside risk. It will not mean that we are forecasting a
sharp decline, although a sharp decline during the second half of
September is a possibility worth taking into account.
Note that the above discussion relates to the US$-denominated gold
price. We are becoming increasingly concerned about the short-term
outlook for gold in US$ terms and are short-term bearish on gold in Yen
terms, but we are neutral-to-bullish on gold in terms of all the other
major currencies. Furthermore, we remain short-term bullish on gold
relative to the industrial metals (including silver).
Gold Stocks
...the
strength of the gold sector over the past few trading days is
consistent with our view that an Oct-Nov LOW is on the cards. However,
for the price action to remain consistent with our current expectation
the HUI should not make a new rebound high after the middle of this
month.
We made the following comments in the e-mail sent to subscribers at the beginning of this week:
"...we are now
downgrading our short-term outlook on the gold sector -- as represented
by the AMEX Gold BUGS Index (HUI) -- from "neutral" to "bearish". As
was the case when we recently turned short-term bearish on the US stock
market we suspect that the HUI will make some additional gains over the
coming week or so, but with the recent rebound having retraced about
half the July-August decline our opinion is that the short-term
risk/reward ratio is now decisively skewed towards risk. As discussed
in recent commentaries, our view is that the odds favour a decline to
an October-November low from whatever peak is put in place during the
first half of September."
This is a good time to emphasise that our market views are always based
on considerations of risk versus reward; or, to put it another way, our
market views are never just based on the expected future price
direction.
The best way to explain how we tend to look at things is via a
hypothetical example, so let's assume, for illustrative purposes, that
we come to the conclusion that a market we are following has a 60%
chance of rising 10% and a 40% chance of falling 30% over the timeframe
in question. In this case we will be bearish on the market even though
we think there's a 60% chance of a price rise because the much larger
magnitude of the potential loss (the downside risk) more than offsets
the higher probability of the potential gain. In practice (as opposed
to in a hypothetical example) there are always more than two potential
outcomes and we can never be certain of the probabilities, but this
example hopefully sheds some light on what we mean when we use the
terms "bullish" and "bearish".
As far as the gold sector is concerned, we think the short-term
downside risk is now materially greater than the potential short-term
upside. Our reasoning boils down to:
1. The odds favour a sharp sell-off in the broad stock market over the
coming several weeks, and in the current environment the gold sector
would probably get taken along for the ride unless there were a
concurrent sharp decline in the Dollar Index.
2. A sharp decline in the Dollar Index is very unlikely. Moreover,
there is a significant chance that a re-test of major support at 78-80
will be followed by a substantial (10%+) rally in the Dollar Index.
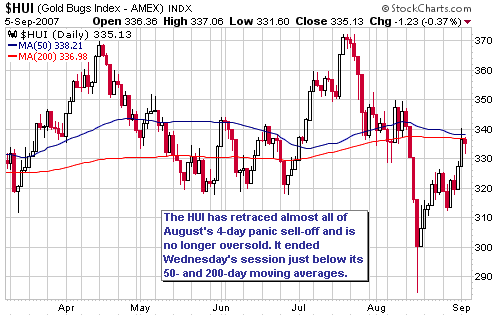
3. As evidenced by the following chart, the HUI has rebounded back to
its 50/200-day moving averages and, in the process, worked off the
oversold condition that existed 2-3 weeks ago.
4. When the HUI broke-out to the downside last month it was a sign that
the reliable October-November cycle was going to produce an important
LOW this year.
Despite our best
efforts there will always be a chance that we've missed something.
Furthermore, even if we somehow manage to take everything into account
and position ourselves in accordance with an accurate assessment of
risk versus reward we may not end up on the right side of the market.
For example, in the hypothetical case mentioned above (60% probability
of a 10% price rise and 40% probability of a 30% price decline) it
would be logical to position ourselves for a bearish outcome because
such a position would offer the most favourable expected return, but in
doing so we would have a 60% chance of being wrong.
By carefully weighing risk against reward we might be able to achieve
above average returns over the long-term, but regardless of what we do
it will never be possible for us to come out ahead in every situation.
There will, in fact, be many situations where our best-laid plans
result in losses rather than gains, which is why money management is
the single most important aspect of long-term investment success.
Immortals who are able to divine the future with absolute certainty do
not need to bother with money/risk management strategies, but the rest
of us need ways of insuring against large losses.
One element of money management is determining, ahead of time, what
would change our assessment of the situation and what we would do if
such a change occurred. This might involve something as simple as
committing to adjust our position in a pre-determined way should the
price move above or below a certain level.
Which leads to the question: what would prompt us to change our view
that the gold sector is probably headed for an October-November low? We
will answer this question by referring to what happened prior to
previous October-November turning points.
Since the beginning of the gold sector's long-term bull market there
have been seven October-November periods, six of which produced
important turning points (the lone exception was Oct-Nov of 2005). And
of these six Oct-Nov turning points, four were lows and two were highs.
The lows occurred in 2000 (November), 2001 (November), 2002 (October)
and 2006 (October), and in each of these cases the HUI rallied into the
first half of September before reversing downward. Additionally, in
three of the four cases the September high was in place by the middle
of the month. The exception occurred in September of 2001 when a high
didn't occur until the 21st of the month, but we suspect that the
lateness of the September-2001 high was solely due to the stock market
being closed for one week in response to the devastating attacks by
terrorists on the 11th of the month. In other words, we suspect that
the September-2001 high would also have been in place by the middle of
the month had the stock market not been shut from the 11th through to
the 16th.
Further to the above, the strength of the gold sector over the past few
trading days is consistent with our view that an Oct-Nov LOW is on the
cards. However, for the price action to remain consistent with our
current expectation the HUI should not make a new rebound high after
the middle of this month. That is, if the HUI closes at a new high for
the month after the end of next week it will indicate that Oct-Nov of
this year is probably NOT going to produce an important low.
The longer-term fundamentals for gold and gold stocks are becoming more
bullish by the week, so a sharp decline to an Oct-Nov low would create
a wonderful buying opportunity. Our own investment portfolio remains
heavily long the gold sector in recognition of these bullish
fundamentals, although we have used the recent strength to moderately
increase our cash reserve. Part of our current plan is to put a
significant chunk of this cash to work in October if the anticipated
buying opportunity materialises.
Update
on Stock Selections
(Note: To review the complete list of current TSI stock selections, logon at http://www.speculative-investor.com/new/market_logon.asp
and then click on "Stock Selections" in the menu. When at the Stock
Selections page, click on a stock's symbol to bring-up an archive of our comments on the stock in question)
 At
the end of July we added the NEM Jan-2008 $45 call options (NEMAI) and
the GFI Jan-2008 $17.50 call options (GFIAW) to the TSI Stocks List.
Given our current outlook it makes no sense for us to hold positions
predicated on the gold sector making significant additional short-term
gains, so we will immediately exit these option positions using
Wednesday's closing prices of $2.40 (NEMAI) and $0.80 (GFIAW) for
record purposes. Our losses on these trades were 4% and 36%,
respectively. At
the end of July we added the NEM Jan-2008 $45 call options (NEMAI) and
the GFI Jan-2008 $17.50 call options (GFIAW) to the TSI Stocks List.
Given our current outlook it makes no sense for us to hold positions
predicated on the gold sector making significant additional short-term
gains, so we will immediately exit these option positions using
Wednesday's closing prices of $2.40 (NEMAI) and $0.80 (GFIAW) for
record purposes. Our losses on these trades were 4% and 36%,
respectively.
If our short-term outlook is off the mark and the gold sector continues
to rally over the next several weeks then the aforementioned options
will reach much higher prices. However, if this happens we won't
experience any "seller's remorse" because our longer-term holdings will
stand us in good stead.
By the way, after buying a stock or an option a person will often
experience the desire to continue holding even if the original reason
for making the purchase no longer applies. A good test of whether your
decision to hold onto a position is based on a logical appraisal of the
facts or, instead, on emotion is to ask yourself the question: if I
didn't already own this investment would I now buy it? If your answer
is an unequivocal no, then you should sell.
 Gammon Gold (AMEX: GRS). Shares: 117M issued, 127M fully diluted. Recent price: US$7.55 Gammon Gold (AMEX: GRS). Shares: 117M issued, 127M fully diluted. Recent price: US$7.55
At this time we are focusing more on short-term selling opportunities
than on buying opportunities, but we don't yet have a full position in
GRS and therefore decided to buy little more of this stock when it
plunged to the US$7.20s on Wednesday. It might turn out that the
operational difficulties that continue to put downward pressure on GRS
are much worse than we realise, but based on what we know today the
stock is a bargain near current levels.
On 17th September GRS will be taking a group comprising 45 analysts and
institutional shareholders on a tour of its Ocampo gold/silver mine in
Mexico. This event has the potential to boost the stock price in the
short-term, especially if the company is able to demonstrate enough
progress to convince some of the analysts to make buy recommendations.
Chart Sources
Charts appearing in today's commentary
are courtesy of:
http://stockcharts.com/index.html
http://www.futuresource.com/

|

