![]()
![]()
![]()
![]()
- Interim Update 5th September 2018
Copyright
Reminder
The commentaries that appear at TSI
may not be distributed, in full or in part, without our written permission.
In particular, please note that the posting of extracts from TSI commentaries
at other web sites or providing links to TSI commentaries at other web
sites (for example, at discussion boards) without our written permission
is prohibited.
We reserve the right to immediately
terminate the subscription of any TSI subscriber who distributes the TSI
commentaries without our written permission.
US Recession Watch
It's time for the monthly update
of our three favourite leading indicators of US recession: the ISM New
Orders Index (NOI), Real Gross Private Domestic Investment (RGPDI) and the
yield curve. It's likely that all three of these indicators will generate
a warning signal ahead of the next recession. The quarterly RGPDI number
won't get its next update until late-October, but there is new information
regarding the NOI and the yield curve.
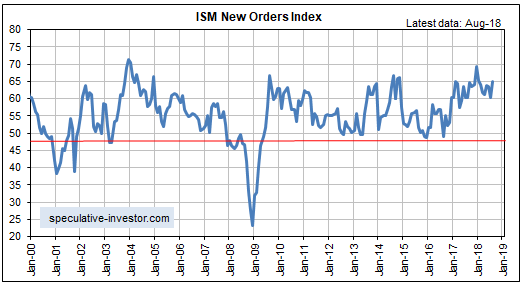
The latest monthly NOI
number (for August-2018) was published on Tuesday of this week. This
indicator has pulled back since making a 13-year high in December-2017,
but it rebounded last month. It is near the top of its 20-year range and a
long way above the level that it would have to drop below (the red line on
the following chart) to warn of a recession.
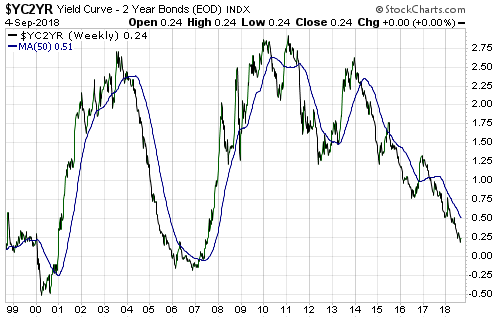
The US yield curve is indicated on the following weekly chart by the
10yr-2yr yield spread. Last week it became its 'flattest' in more than 10
years, meaning that there is no sign yet of the yield-curve trend reversal
from flattening to steepening that generally precedes a recession.
Based on the latest data, our rough estimates of recession start-time
probabilities are:
- Q3-2018: 0% (unchanged from a month
ago)
- Q4-2018: 15% (down from 20% a month ago)
-
H1-2019*: 35% (unspecified a month ago)
- H2-2019*: 40%
(unspecified a month ago)
- Later than 2019: 10% (up from 5% a
month ago)
As previously explained, the main reason for our high
2019 recession probability estimate is that the G2 (US plus euro-zone)
monetary inflation rate appears to have fallen far enough to bring the
artificial boom to an end. However, as also previously explained, the
start of a recession could be delayed to 2020 if within the next few
months the Fed starts taking decisive actions to steepen the yield curve.
Rather than warning of a recession, a yield-curve steepening that was
driven by rising long-term interest rates could herald a 6-18 month
inflationary blow-off.
*A month ago we had a
probability of 80% for a recession start in 2019. This has dropped to 75%.
Uranium
Although it is only up by about
10% year-to-date, uranium has been one of the best-performing commodity
markets in 2018. The relative strength has been driven mainly by news of
reduced mine supply.
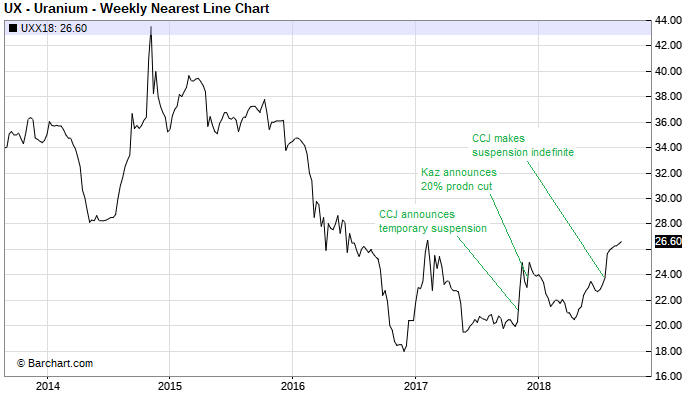
With reference to the following chart, on the
mine-supply front there have been three notable developments for uranium
over the past year. First, in November-2017 Cameco (CCJ) announced the
temporary suspension of operations at its McArthur River and Key Lake
mines in Saskatchewan, Canada. Second, in December-2017 Kazatomprom (a
state-owned enterprise that operates most of Kazakhstan's uranium mines)
announced that it would reduce production by 20% for 3 years. Third,
Cameco announced in July-2018 that its McArthur River and Key Lake mines
would be shut down indefinitely.
These actions on the part of
Cameco and Kazatomprom, the world's two largest uranium producers, are
estimated to reduce global mine supply by 16.5%.
As is the case with the oil market, on the supply side of the uranium
equation there is a significant political risk factor to be considered.
This is because about 40% of the world's current uranium production comes
from Kazakhstan.
With regard to the demand side of the uranium
equation, there are 55 reactors now under construction compared with 455
reactors presently in operation. In capacity (GW) terms, China is expected
to account for about one-quarter of the global growth in demand.
Also, the Electric Vehicle (EV) trend will lead to greater demand for
electricity from the grid, which could lead to greater demand for uranium.
Whether it does or not obviously will depend on how the additional demand
for electricity is met, and this will be based on politics as much as or
more than economics. It's important to understand that the increased usage
of EVs likely will provide no pollution-related benefits if the additional
electricity required to charge EV batteries comes from coal-fired power
plants.
We like the idea of maintaining some long-term exposure to
uranium, but we don't have an opinion on when a major upward trend in the
uranium price will occur.
It probably would take a sustained rise
in the uranium price to above $40/pound to make a meaningful difference to
the uranium-mining industry, although traders of uranium mining stocks are
usually quick to turn bullish in response to signs of strength. Therefore,
it might only require a move above $28/pound in the commodity price to
ignite the next surge in the associated equity prices.
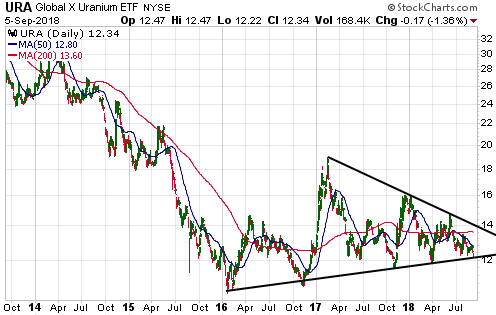
The
following chart shows that at the close of trading on 5th September the
Global X Uranium ETF (URA), a proxy for the uranium-mining sector, was
near the bottom of its 20-month range and right at trend-line support.
This is not a bad place to buy, but be aware of the risk that a daily
close below $12.00 could lead to a sharp decline.
The Stock Market
The US
The following chart of the Investors Intelligence Bull/Bear ratio from
Yardeni.com reveals an interesting similarity between 1987 and 2018. In
both years the Bull/Bear ratio hit a major high in January, plunged to a
low later in the first half of the year and then rebounded to an August
high, with the August high being well below the January high. In 1987,
August's lower high in the Bull/Bear ratio marked a very important
stock-market top and the start of a crash pattern that ended with a bona
fide crash in October.
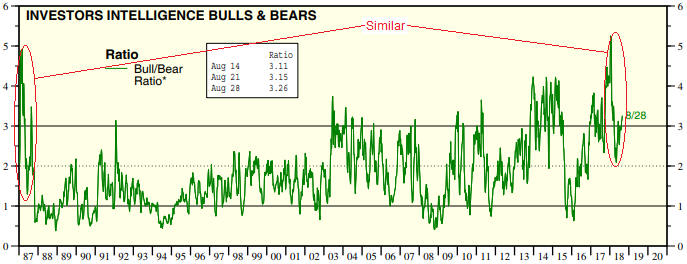
We aren't expecting or forecasting a US stock market crash in October
of this year, at least not yet. In order to set the scene for an
October-2018 crash there will have to be something along the lines of the
following sequence:
1) A sharp decline of at least 4% (basis the
S&P500 Index) during the first half of September.
2) A choppy 2-4
week rebound that ends below the late-August high.
3) A return to
the September low.
4) A breach of the September low.
Step 4
in the above sequence could lead to a dramatic plunge (a crash) as many
trading systems simultaneously attempt to exit.
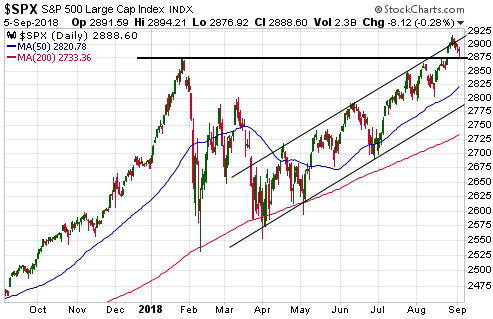
What we have right
now (see below) is a market that broke out to an all-time high last week
and has pulled back to 'test' the breakout.
The Emerging Markets
There recently have been
a lot of headlines about the "emerging markets" being in crisis. But while
it's certainly true that the economic situations in Argentina and Turkey
are severe enough to warrant the crisis descriptor, the evidence at this
time does not point to a general emerging-markets crisis.
For
example, although the iShares MSCI Emerging Markets ETF (EEM), a proxy for
equities across the 'emerging' economies, is down by about 20% from its
January-2018 high, the decline currently looks more like an
intermediate-term bull-market correction than an unfolding crisis.
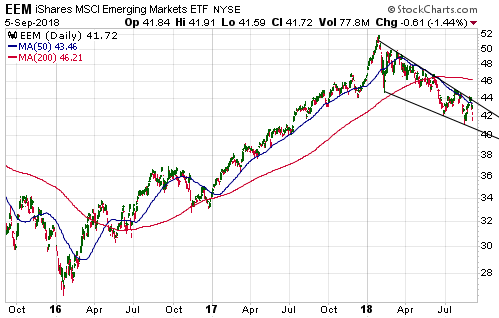
It's a similar story with the iShares Emerging Markets Bond ETF (EMB).
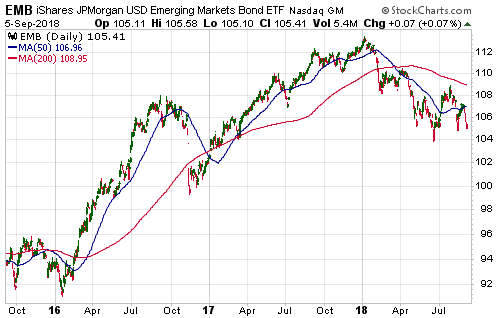
Note that because EEM and EMB are US$-denominated they reflect changes
in currency exchange rates as well as changes in asset prices. In other
words, the charts displayed above take into account the general weakness
over the past several months in emerging-market currencies relative to the
US$.
The above charts aren't suggestive of a crisis in motion, but
in any case it is not a good time to be buying EEM or EMB. This is due to
the risk that the intermediate-term declines that began in January will
end via capitulations during September-October. To put it another way,
there's too much risk that the orderly decline will turn disorderly before
it ends.
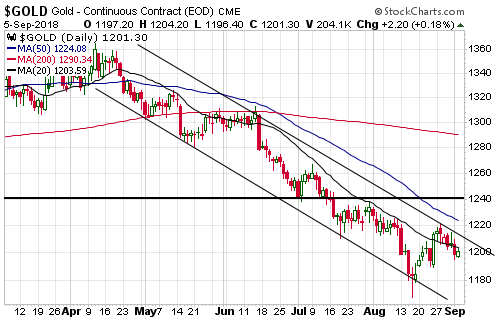
Gold and the Dollar
Gold
Unlike the US$ silver price and the gold-mining indices, which made new
2-year lows this week, the US$ gold price remains well above its
mid-August low. Furthermore, although the gold price has dropped below its
20-day MA, gold's decline from last week's high looks more like a
correction to a new short-term upward trend than a resumption of the
short-term downward trend.
We therefore have a non-confirmation on
our hands, in that this week's breaks to new lows by silver and the
gold-mining sector have not been confirmed by gold bullion.
Non-confirmations often occur around important turning points.
Silver
The silver price ended last week at
$14.44. As mentioned in the Weekly Update, the price action suggested that
there was a high risk of breaking below the August low in the $14.30s and
a distinct possibility of a decline to the $13.50-$14.00 range in the
near-term.
The following daily chart shows that there was a spike
below $14.00 on Tuesday of this week and then a small rebound on
Wednesday. It also shows that Tuesday's low of $13.94 coincided with the
bottom of what is now a well-defined channel.
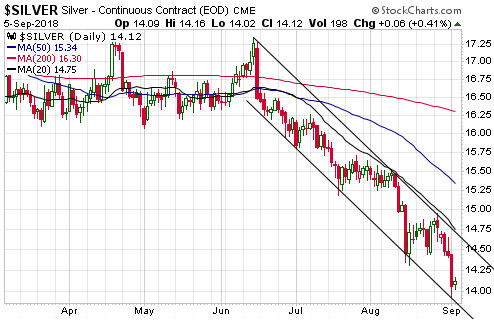
Tuesday's decline in the silver price combined with the much smaller
decline in the gold price took the silver/gold ratio to a new 20-year low.
Silver is VERY cheap relative to gold, but this fact provides us with no
clues about what will happen to the prices of gold and silver over the
next couple of months. All it tells us is that long-term investors in
precious metals should be favouring silver over gold at this time.
Our guess is that this year's bottom for silver will be in the
$13.50-$14.00 range. In fact, the bottom for the year may have occurred on
Tuesday 4th September, although at this time there is no evidence of that
in the price action. The first real evidence of a bottom would be a daily
close above the 20-day MA and the top of the channel drawn on the above
chart.
Gold Stocks
In the latest Weekly
Update, we wrote:
"The weakness of the HUI's rebound from its
August low suggests that we are dealing with either the first leg of a 1-3
month counter-trend rebound or a bounce within a continuing short-term
downward trend. If it's the latter then a test of the August low or a
plunge to new lows during September potentially would set the stage for a
more interesting rally."
We now know it was the latter (a
bounce within a continuing short-term downward trend), because a plunge to
new lows has occurred.
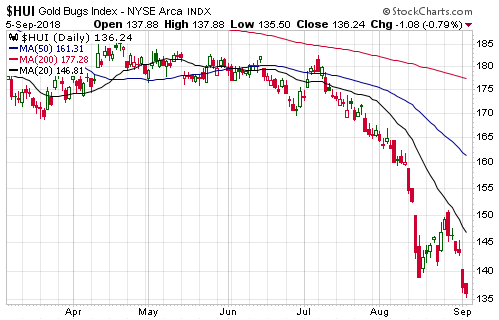
The plunge to new lows could be setting up a substantial rally, but
clearly there is no evidence yet that a bottom is in place.
Regardless of whether or not the gold-stock capitulation has run its
course it looks like we are going to get an inversion in 2018 of the Q4
pattern of the past few years. Rather than a decline to a
November-December low, as occurred in 2013, 2014, 2015, 2016 and 2017, the
recent price action makes it more likely that there will be a rally to a
November-December high in 2018.
In anticipation of the
aforementioned rally it could make sense for risk tolerant speculators to
accumulate January-2019 call options on gold-mining ETFs or major gold
stocks this month. To reflect this view we are adding the Gold Fields Ltd.
(GFI) January-2019 $3.00 call option at US$0.10. The option ended
Wednesday's session at US$0.09-$0.10.
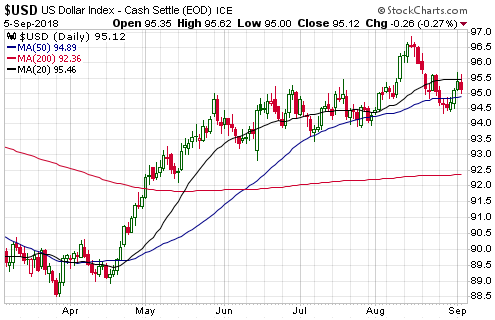
The Currency Market
As far as the major currencies are concerned, this week has been
uneventful to date. The Dollar Index (DX) rose to its 20-day MA on Tuesday
and then gave back Tuesday's gain on Wednesday (there having been no
trading in the US futures markets on Monday due to the public holiday).
Rounding off to one decimal place, at the close of trading on Wednesday
the DX was exactly where it was at the end of last week.
We
continue to expect that the DX will have a downward bias, that is, make a
sequence of lower highs and lower lows, over the coming few weeks.
Updates on Stock Selections
Notes: 1) To review the complete list of current TSI stock selections, logon at
http://www.speculative-investor.com/new/market_logon.asp
and then click on "Stock Selections" in the menu. When at the Stock
Selections page, click on a stock's symbol to bring-up an archive of
our comments on the stock in question. 2) The Small Stock Watch List is
located at http://www.speculative-investor.com/new/smallstockwatch.html
![]() Revisiting
an old friend
Revisiting
an old friend
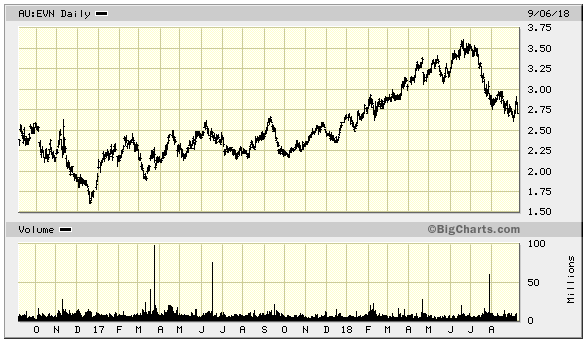
At this time last year Evolution Mining
(EVN.AX) was not only a member of the TSI Stocks List, but also the
largest gold-stock holding in our own account. However, in February of
this year we removed it from the TSI List when it was trading in the
A$2.80-$3.00 range.
The main reason for the removal was to reach
our goal of reducing the number of long-term TSI positions to 15, but we
also noted that EVN was a relatively conservative stock that did not offer
substantial leverage to changes in the gold price. The lack of leverage
was expected to cause EVN to be relatively strong during periods of
lethargy or weakness in the bullion market and relatively weak during
intermediate-term rallies in the bullion market. At the time we were
anticipating a period of bullion market weakness, so we thought that EVN
would do relatively well in the short-term and underperform after the gold
market eventually turned the corner.
At around the same time that
EVN was removed from the TSI List we sold about one-third of our own
position in the A$2.90s. We then sold another third in June after the
stock price moved up to the A$3.50s in the face of a weak bullion market
(a stock is either 100% in or 100% out of the TSI List, but when managing
money we usually scale into and out of positions over time). Our plan at
that time was to sell the balance if the stock price rose to near A$4
within the ensuing few months, but it turned out that the A$3.50s was an
important peak. Consequently, we still own one-third of the position we
held at the start of this year.
From its June high near A$3.60 the
EVN stock price trended downward and hit a 6-month low near A$2.60 in
late-August (last week). We suspect that last week's low will hold for
many months.
Is EVN now a good candidate for new buying?
For risk-averse
investors looking for some exposure to gold the answer is yes, because EVN
is possibly the world's lowest-risk gold-mining stock. However, at this
time we aren't interested in returning it to the TSI List or buying more
EVN shares for our own account. The reason is the lack of leverage that we
mentioned in February.
The lack of leverage was underlined by a
3-year production forecast issued by the company early this week.
Production is forecast to trend downward, from the FY2018 amount of 801K
ounces to around 725K ounces in FY2021, while the AISC/ounce is expected
to remain in the A$800-A$850 (US$600-US$640) range.
The low
production cost all but guarantees that EVN will continue to be strongly
cash-flow positive and pay healthy (by gold-mining standards) dividends
over the years ahead. Also, it should put a floor under the stock price.
However, the combination of declining production and low production cost
suggests minimal leverage. Minimal leverage to the gold price will be a
plus while the gold market remains in the doldrums but will become a minus
after the next intermediate-term gold rally kicks off.
With its
strong balance sheet and declining production it is clear that EVN should
make one or more sizable acquisitions within the next 12 months.
Based on the past performance and stated preferences of EVN's senior
management, the subject of any sizable acquisition would have to be a
low-cost (<US$675/oz AISC) and long-life (>10 years) 100K+ ounces/year
mine or potential mine in a low-risk country. The right target at the
right price may not be available in Australia, so we won't be surprised if
EVN branches out from Australia to North America in the not-too-distant
future.
We will reassess EVN after it makes its next substantial
acquisition.
 Update to the
TSI Small Stocks Watch List (SSWL)
Update to the
TSI Small Stocks Watch List (SSWL)
The SSWL is
a list of stocks that are too risky and/or illiquid to be considered for
the TSI Stocks List. We don't track these stocks closely in the TSI
commentaries, but they have favourable risk/reward ratios (in general:
high risk versus much higher potential reward) and could be of interest to
speculators who are able to do their own due diligence. Today we are
commenting on the recent progress made by one member of the SSWL.
The stock is Breaker Resources (BRB.AX), an exploration-stage miner
focused on the Lake Roe gold project in Western Australia. BRB has about
146M shares on issue (157M fully diluted) and A$5M of cash. It traded
above A$0.70 in January of this year and was added to the SSWL after it
had plunged to an 18-month low of A$0.24 in May.
The main reason
for the large decline in the stock price was the high expectations
regarding the initial resource estimate for the Bombora deposit at the
Lake Roe project. When the initial resource turned out to be smaller than
expected, the share price collapsed.
Here's an excerpt from the
write-up included in the 7th May Weekly Update:
"We've been
following BRB for about a year due to the potential indicated by numerous
holes drilled into the Bombora deposit, but until recently it didn't
interest us as a speculation due to the high expectations that were built
into the share price. Now, however, expectations appear to be too low,
setting up an attractive risk/reward.
It's not like the initial
resource estimate was a disaster. After little more than a year of
exploration work following a greenfields discovery, the company has
defined a total open-pit resource comprising 624K ounces with an average
grade of 1.6-g/t (a good grade for an open-pit gold mine). It's expected
that the resource will grow to at least 800K ounces by year-end and to at
least 1M ounces next year."
BRB's management appears to have
learned its lesson. After setting expectations too high prior to the
initial resource estimate it subsequently set them low enough to enable a
positive surprise. The positive surprise was announced earlier today in
the form of an updated resource estimate revealing that next year's goal
of having a >1M-oz resource has already been achieved.
The updated
total gold resource is 1.08M ounces grading 1.4-g/t, including a
high-grade core comprising 808K ounces grading 2.0-g/t. Furthermore, the
company has already commenced a PFS to assess the potential for open pit
development.
This is very good news. Although BRB's stock price
gained 25% on the ASX today, it is still close to its 2-year low and has a
very attractive risk/reward.
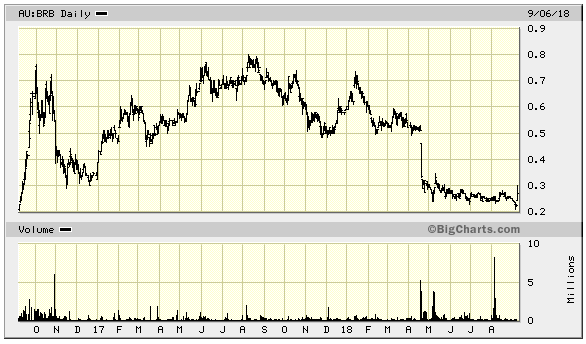
Chart Sources
Charts appearing in today's commentary
are courtesy of:
https://stockcharts.com/
https://www.barchart.com/
http://bigcharts.marketwatch.com/
![]()