|
- 06 March, 2002
Growth
and Interest Rates
Long-term interest rates bottomed way
back in October of 1998 and spiked-down to test their 1998 lows in early-November
of last year. They've since bounced, ostensibly because the economy is
recovering. While we believe the economy is recovering and will continue
to grow over the next several months, we do not accept the argument that
the re-emergence of economic growth is the cause of the recent rise in
long-term interest rates. Why? Because the argument is not supported by
either history or logic.
Let's start by looking at history.
Below is a chart comparing the yield on the 10-year T-Note with the GDP
growth rate since 1980. The two shaded areas on the chart highlight the
periods immediately following the 1981-1982 and 1990-1991 recessions when
economic growth rebounded while interest rates fell.
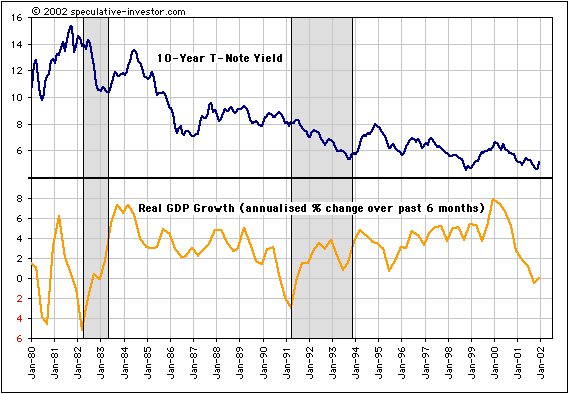
There have certainly been periods when
interest rates rose together with rising economic growth. However, rather
than rising as they have been doing since the economy bottomed late last
year, it is normal for interest rates to fall during the initial
stage (at least the first 12 months) of a sustainable economic recovery.
The recessions of 1981-1982 and 1990-1991
were followed by prolonged economic expansions and were supported, in their
initial stages, by falling long-term interest rates (in fact, both
the economy and the stock market received some support throughout the 1980s
and 1990s by the secular trend towards lower interest rates that began
in 1981). This pattern was particularly evident in the early-1990s when
long-term interest rates continued to move lower for 3 years after
the recession had ended, thus setting the scene for a prolonged period
of economic growth and rising asset prices.
What happens when interest rates rise
as the economy moves out of recession as they are doing now? The 1980-1981
period provides us with an example of such a situation. Economic growth
rebounded strongly during the second half of 1980 and the first half of
1981, but interest rates also moved higher. Rising interest rates then
cut-short the economic expansion and by late-1981 the economy was back
in recession.
To recap the above, long-term interest
rates have fallen during the early stages of the two prolonged economic
expansions of the past 22 years. This makes some intuitive sense because
in a 'normal' economic environment a rebounding economy reduces the risk
of long-term lending. When interest rates rise in parallel with a growing
economy it isn't economic growth that the bond market is concerned about,
it is inflation. During a 'normal' economic environment the money-supply
growth rate falls to a low level during a recession and then begins to
rebound when the economy recovers. It then usually takes years for the
money supply growth rate to rise to a level that prompts the lenders of
long-term money (eg, the buyers of bonds) to begin building a large inflation
premium into long-term interest rates.
We keep referring to a 'normal' economic
environment, but the current environment is most definitely not normal.
During last year's supposed recession the money supply growth rate surged
to its highest level in 30 years. Now we have a recovery, but rather than
interest rates falling and the money supply growth rate rising as the economy
embarks on a period of expansion we have exactly the opposite scenario.
The money supply growth rate peaked at a very high level towards the end
of last year and is now falling while long-term interest rates work their
way higher. Rather than a normal economic environment, what we are seeing
today is just another phase of the same old credit bubble.
The implication for the stock market
is that the post-September rally does not represent a new bull market
(as is the case with sustainable economic expansions, the initial stages
of new bull markets occur in parallel with falling long-term interest rates)
. In fact, it doesn't represent a new anything. In some respects it doesn't
even make sense to refer to it as a bear market rally since the real bear
won't appear until the credit bubble bursts.
In the next weekly update we'll review
the money-supply growth situation in light of what is happening in the
bond market and revisit a point we've made many times over the past 2 years:
that the current US situation is very different from the situation in early-1990s'
Japan.
Quick bond
market update
We remain extremely bearish on bonds
taking a 12-month view because we think the inflation premium that is currently
built into long-term interest rates is way too low. Refer to the 2nd January
Interim Update ("Bond crash to continue in 2002") for further explanation.
We do, however, still think there is a reasonable chance that bonds will
make one last-ditch bear-market rally attempt before a major decline begins.
That rally is likely to occur some time between now and May.
The US
Stock Market
Current Market Situation
In the latest Weekly Update we mentioned
that a decisive move by the S&P500 above its 200-day moving-average
would be sufficient to invalidate our short-term bearish view. As it turned
out, however, we didn't wait for the S&P500 to surmount this technical
hurdle before putting our short-term bearish view on hold.
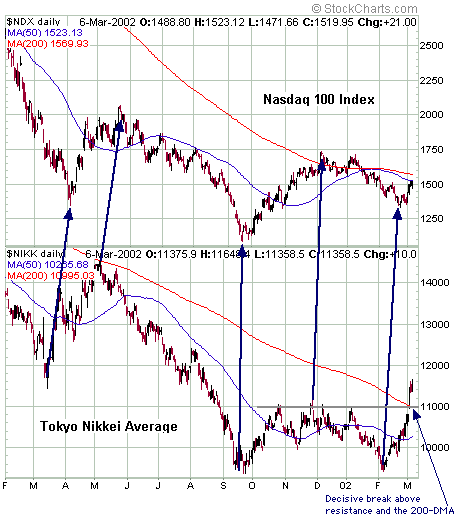
When the Japanese Nikkei225 Index exploded
above resistance and its 200-DMA during Asian trading on Monday we put
out an e-mail alert canceling our recommendation to buy QQQ put options.
Based on the lead/lag relationship between the Nikkei and the US stock
market that has worked so well over the past year it became clear, once
the Nikkei had made such a pronounced upside breakout, that the US stock
indices were headed much higher. As such it made no sense to buy put options,
at least until some evidence emerged that the rally was running out of
steam. The below chart, in which the NASDAQ100 (NDX) is used to represent
the US market, illustrates this relationship. Note how the Nikkei has led
the NDX at every important turning point since the beginning of last year.
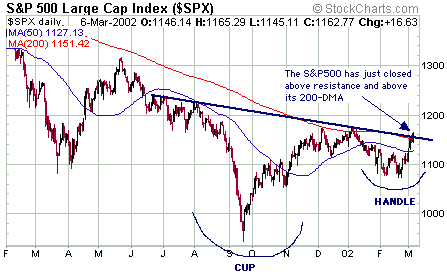
Below is a chart of the S&P500
Index. The price action is unequivocally bullish and should be respected.
During the final quarter of last year
and the first two weeks of this year our thinking was that the stock indices
would remain strong during the first few months of the year and would likely
reach a peak during the March-May period. However, after seeing the S&P500
fail in its second attempt to break above its 200-DMA in early-January
and the Nikkei break below the bottom of its trading range in late-January,
we turned short-term bearish on the market and profitably traded some QQQ
put options. Now, after providing a few levels of bearish confirmation
over the past several weeks, the market has just done another 'about face'.
Earlier in today's Update we argued
(persuasively, we hope) that the post-September rally does not constitute
a new bull market. What it does constitute is another phase of the on-going
credit bubble. Furthermore, our assessment is that we are much closer to
the end of something than to the beginning of something.
Looking beyond the short-term the stock
market is in a hopeless position because the more successful last year's
Fed-sponsored monetary expansion is in boosting prices and consumer spending,
the worse it will be for the bond market. As we've explained in the past,
current stock valuations can only be justified if we are entering a prolonged
period of strong economic growth and falling long-term interest
rates. If interest rates continue to rise, as they must do to discount
the effects of the monetary inflation that has already occurred,
then the major stock indices will eventually fall to much lower levels.
As to how the story will unfold over
the next few months, we are probably within several days of a short-term
peak. However, there is now a good chance that the next pullback will make
a higher-low (at least as far as the Dow Industrials and the S&P500
are concerned) and will be followed by another move to new post-September
highs.
Although higher levels are now a distinct
possibility over the next 2-3 months, the major risk remains on the downside.
As such and as discussed in E-Mail Alert #73 sent to subscribers on Monday
morning, we think the best risk/reward balance can still be found in the
gold sector. This is because gold stocks have the potential to benefit
from a general stock market decline, a falling Dollar or a situation
where massive inflation pushes the stock indices higher. Also, we continue
to like the stocks of the commodity producers (as we have done since September-October
of last year).
Commodities
Prior to September-11 last year our
forecast was for commodity prices, as represented by the CRB Index, to
bottom in September and then embark on a multi-year bull market. As a result
of the events of September-11 we said that the bottom for the CRB would
probably be delayed by 2-3 months, but that the eventual upturn would be
more pronounced given the massive monetary injection in the wake of the
terrorist attacks. The "big picture view" for commodity prices that we
include at the top of every Weekly Update has been unchanged since 1st
October of last year and states that the CRB Index "will reverse higher
by the first quarter of 2002 (at the latest) and then rally over the ensuing
1-2 years".
We've been waiting for technical confirmation
of a bottom in the CRB Index before turning short-term bullish on commodities,
with part of that technical confirmation being strength in the major commodity
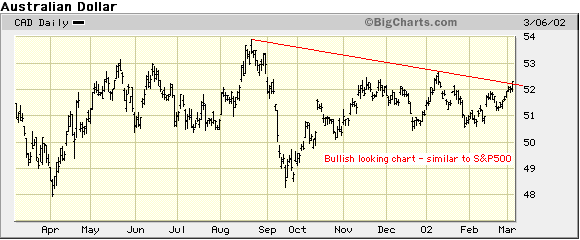
currencies (the A$ and the C$). The below chart of the A$ is certainly
bullish, although the upside breakout is not yet decisive.
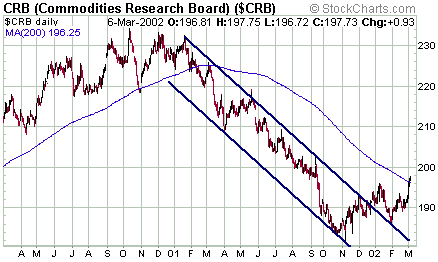
Below is a chart of the CRB Index.
The CRB Index broke-out from its 12-month downtrend last December, then
made what now clearly appears to be a normal breakout pullback before surging
to a new post-September recovery high. It has also closed above its 200-DMA.
Both the A$ and the CRB Index are moving
with the S&P500, so the biggest risk with commodities (and with the
A$) is that the stock market tanks. However, the evidence of a CRB bottom
is now compelling enough to bring our short-term view into line with our
bullish longer-term view.
Gold and
the Dollar
The BOE Fire Sales
We've read several articles over the
past week explaining that the BOE gold auctions that began in 1999 were
a disaster for the UK Treasury because the gold was sold too cheaply. Apparently,
the gold was sold for $200M-$300M less than what it is now worth on the
spot market. However, to measure the success or failure of the auctions
by looking at what the gold is now worth versus what they got for it is
to completely miss the point.
Claiming that the auctions were some
sort of stupid mistake because the gold was sold too cheaply assumes that
the goal of the auctions was to get the best possible price. Nothing could
be further from the truth. The purpose of the auctions was to sell gold
at the lowest possible price, not the best possible price.
The world's leading central bankers
and treasury officials aren't mentally-challenged, they are ethically-challenged.
The fact that gold is still below $300 indicates that the auctions were
a resounding success and we give the BOE, the UK Treasury, the Fed and
the US Treasury top marks for designing and successfully implementing a
strategy that has helped them achieve one of their objectives. The two
hundred million dollars or so of opportunity cost sustained by the UK Treasury
is just a drop in the ocean compared to the money that has been made/saved
by prolonging the life of the credit bubble by a few more years. However,
the fact that the gold price is presently $40 higher than it was in July-1999
(at around the time of the first auction) means that natural market forces
are beginning to overwhelm the price-fixers.
Current Market Situation
The Dollar has displayed enough weakness
over the past week to significantly reduce the probability that a rally
over the next few weeks (what we expect to be the final rally prior
to a major decline) will take the Dollar Index to new multi-year highs.
It now looks like the best case for the Dollar will be a re-test of the
January high.
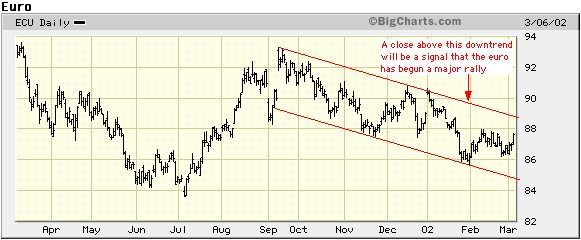
Below is a chart of the euro. We are
looking for a break above the 6-month downtrend to confirm that a major
euro rally (Dollar decline) has begun.
Gold appears to be in a state of suspended
animation with bears defending $300 and bulls defending $290-$292. Another
surge over the next month is still a likely prospect, while the maximum
downside potential that we can envisage if the $290 level gives way is
to the low-$280s.
Update
on Stock Selections
In E-mail Alert #73 we recommended
buying Barrick Gold (ABX) July $20 call options. This is the first time
we've ever recommended taking any position in ABX. The way some gold market
commentators talk you get the impression that ABX deserves to be included
in George Bush's "axis of evil". Our view, however, is that ABX's senior
management just don't 'get it'. They don't understand their product and
they don't understand what motivates investors to buy gold stocks. The
management problem is a reason not to invest in ABX, but it is not a reason
to forego a short-term trade when an opportunity presents itself.
Below is a chart of ABX. The action
over the past 4 weeks looks like a consolidation within a continuing up-trend.

Our trading position in TVX was stopped-out
for a small profit on Tuesday when the stock sold off on news of a large
write-down and a 1-for-10 reverse split. With speculative stocks such as
TVX it is important to rigidly adhere to protective stops and not to second-guess
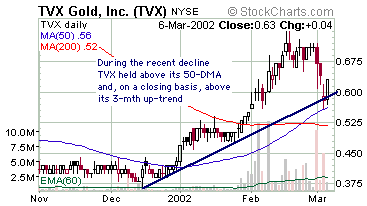
the market. As such, we are officially 'out' of the stock. Having said
that, TVX's recent price action is not particularly bearish. In fact, the
below chart shows that the recent decline found support at the 50-day moving-average
and did not violate the short-term up-trend. A close below the 50-DMA would,
however, be very bearish. We may come back to TVX in the future (perhaps
after the 1:10 split has been completed) since the reasons we liked it
in the first place (its American gold assets) are intact.

|

