|
- Interim Update 6th March 2013
Copyright
Reminder
The commentaries that appear at TSI
may not be distributed, in full or in part, without our written permission.
In particular, please note that the posting of extracts from TSI commentaries
at other web sites or providing links to TSI commentaries at other web
sites (for example, at discussion boards) without our written permission
is prohibited.
We reserve the right to immediately
terminate the subscription of any TSI subscriber who distributes the TSI
commentaries without our written permission.
Out of
synch
Two weeks ago we wrote:
"At no stage over the past 10 years have we been as out-of-synch
with the markets as we have been over the past couple of months. The
problem, from our perspective, is that during this period several
markets and indicators reached extremes that almost always led to
price reversals in the past, but this time around did not. Instead,
the markets and indicators went to even greater extremes.
In some cases, most notably the Yen and the gold sector of the stock
market, what we thought were 'oversold' extremes were surpassed by a
wide margin to the point where records that had held for 10 years or
more were equaled or broken. Other noteworthy extremes have occurred
in stock market volatility (the VIX reached its lowest level since
the first half of 2007) and gold market sentiment..."
Even greater extremes have since been reached, making us even more
out-of-synch with the markets. The question is: What do we do about
it?
The answer is: Not much. We'll learn from the experience, or to put
it more aptly we'll re-learn from the experience. In particular,
we'll re-learn the old lesson that when it comes to sentiment,
momentum and valuation there are no absolute benchmarks. But we
don't see a good reason to make substantial portfolio changes. We
have no inclination to react to the large price rises that have
occurred in some markets by increasing our exposure to those markets
and no inclination to react to the large price declines that have
occurred in other markets by reducing our exposure to those markets.
This is because nothing has happened to alter our long-term views.
In fact, the incredible extremes that markets have recently attained
are, first and foremost, reactions to policies that underline the
correctness of our long-term views even while they temporarily cause
prices to move rapidly against us. Also, when you are out-of-synch
with the markets in a big way the last thing you should do is get
more aggressive in a desperate attempt to quickly recoup your
losses.
To account for the reality that there are no absolute benchmarks
when it comes to the extent to which prices and valuations can rise
or fall, we use two tactics. The first is that we scale into and out
of positions gradually over time. The second is that we set limits
on the amounts of money that we will put at risk in any single
market, stock-market sector and individual stock.
The second of these tactics is recognition of the fact that our
financial resources are not infinite and, therefore, that the
scaling process cannot continue indefinitely. Taking the topical
example of the gold sector, which is by far our favourite stock
market sector for the long term, we reached the self-imposed limit
on our exposure some time ago. We therefore haven't responded to the
most recent sector-wide price plunge by scaling-up our overall
exposure to this sector. However, we've still been active, in that
the indiscriminate nature of the recent sell-off has provided
excellent opportunities to increase the quality of our exposure
while maintaining the quantity of our exposure at roughly the same
level. We mentioned this opportunity in previous commentaries and
discuss it again in the "Gold Stocks" section of today's report.
US money
market funds (MMFs) return to the party
The general willingness to take on more risk in
order to obtain higher yield is infecting US MMFs. Due to the obvious problems
in Europe's banking industry and the risk of sovereign default in the euro-zone
(EZ), the US MMF industry had steadily reduced its exposure to euro-denominated
debt until around mid last year. However, there has since been a change of
heart. We read a few days ago that the 10 largest US MMFs had increased their
exposure to euro-denominated debt by an average of 90% since May of 2012.
Most people think of MMFs as cash, but they aren't cash; they are investments in
debt securities. When you put money into a money-market fund you are making an
investment in bonds and notes. If you are invested in one of the largest US MMFs
then you probably have some exposure to euro-zone bank debt.
The Stock Market
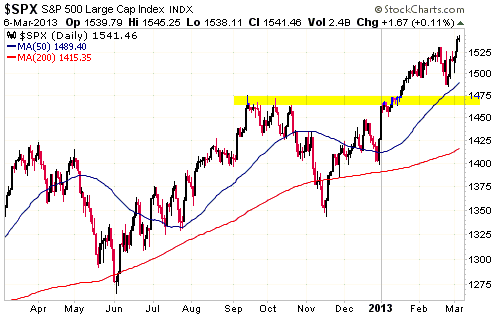
As a result of this week's price action we can now be sure that
if the "March cycle" is going to 'work' in 2013 then it will produce an
important high (a high that holds for at least a few months). This is because
the S&P500 has just made a new high for the year.
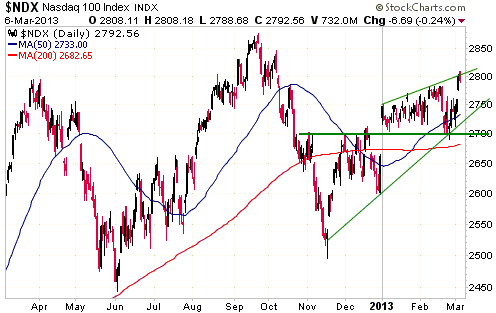
We only ever place emphasis on a cycle in the specific case where a market
trends strongly into a cycle-related turning-point window and then reverses
direction. What we now have in the stock market is a strong trend into a
cycle-related turning-point window. What we don't yet have is a definitive price
reversal. An example of a definitive price reversal would be a daily close by
the NASDAQ100 Index (NDX) below 2700.
During the first three days of this week the NDX rose to the top of its "rising
wedge" pattern. In our experience "rising wedge" patterns aren't inherently
bearish, because they are as likely to result in upside breakouts as downside
breakouts. However, they become indicative of a bearish turn of events if the
price breaks below the bottom of the pattern.
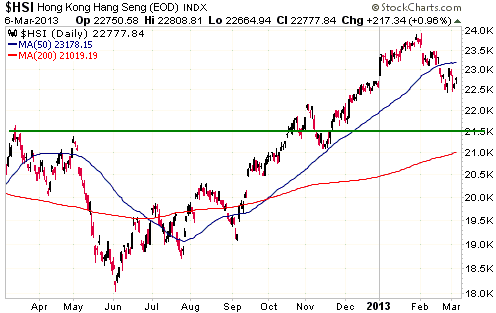
Hong Kong's Hang Seng Index (HSI) has been working its way downward since late
January. This could be significant due to the HSI's tendency to lead at
important stock market tops and bottoms, but at this early stage the HSI's
decline could just as easily be a routine short-term correction as the start of
an intermediate-term downward trend.
Gold and the Dollar
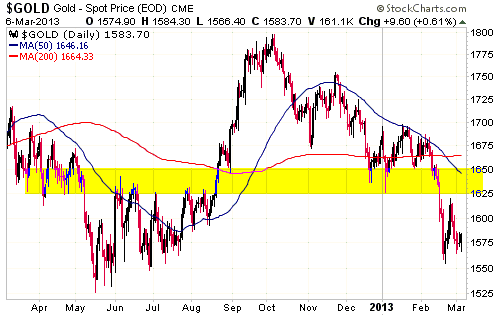
Gold
It's possible that this week's decline in the US$ gold price to the low-$1560s
was the expected test of the February low. Neither we nor anyone else knows.
What we do know is that the sentiment situation remains bullish for gold. Of
particular note is that Market Vane's bullish percentage for gold hit a new
10-year low of 48% early this week. This is remarkable considering that
sentiment usually just follows the price and that gold has essentially traded
sideways over the past two years. It constitutes a substantial bullish
divergence between sentiment and price, in that sentiment has become far more
bearish than is justified by the price action.
Resistance at $1625-$1650 is a reasonable short-term upside target. A weekly
close above the top of this range would confirm that an important bottom was in
place.
Gold Stocks
Redemption Song
As mentioned above and also in previous recent commentaries, relatively
high-quality gold mining stocks have lately been hit as hard as relatively
low-quality gold mining stocks. In fact, in some cases the high-quality stocks
have been hit the hardest, creating good opportunities to improve the quality of
one's portfolio by switching between stocks. As well as being less risky, the
relatively high-quality stocks are likely to be the quickest to recover after
the gold-stock indices bottom-out. This will lead to a future opportunity to
switch in the other direction due to the less-risky stocks becoming over-priced
relative to their higher-risk brethren.
As to why the higher-quality stocks would in some cases have sold off even
harder than the lower-quality stocks, the most plausible explanation is that
gold-stock funds have been getting hit with redemptions. The funds are being
forced to sell to meet redemptions and are selling wherever they can find
liquidity, as opposed to selling what they would prefer to own less of.
The TSI gold stocks that we think have the highest quality, where highest
quality means the most favourable combination of balance sheet, location, mining
assets and management, are (in alphabetical order) Almaden Minerals (AAU),
Endeavour Mining (EDV.TO, EVR.AX), Evolution Mining (EVN.AX), Pretium Resource (PVG),
and Sabina Gold and Silver (SBB.TO). Charts are presented below. Along the lines
of what we've been talking about, these five stocks have recently been among the
worst performers. We increased our exposure to each of these stocks during the
first half of this week, with new purchases mostly funded by sales elsewhere.
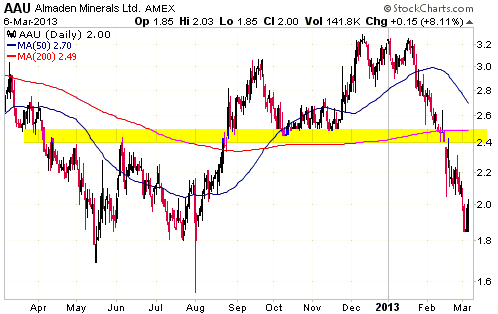
1) Almaden Minerals (AAU), a prospect generator, traded as low as US$1.85 during
the first two days of this week. There is strong support at $1.70-$1.80 and
initial resistance at $2.40-$2.50. In a more normal market, the decline from the
January peak would have ended at $2.40-$2.50.
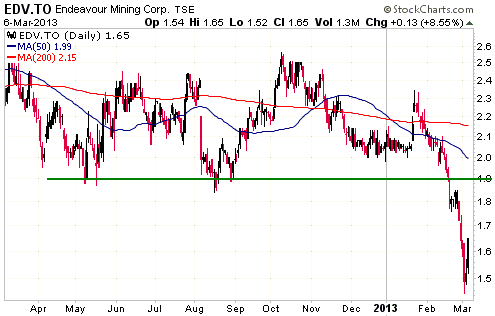
2) Endeavour Mining (EDV.TO, EVR.AX), a profitable 330K-oz/yr producer with
operations in West Africa, traded as low as A$1.34 in Australia and C$1.45 in
Canada earlier this week, creating an exceptional buying opportunity. Initial
resistance lies at C$1.90.
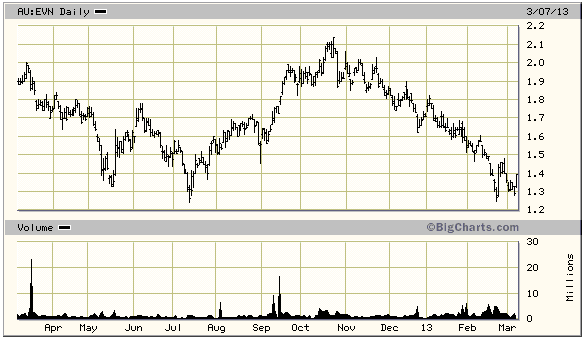
3) Evolution Mining (EVN.AX), a profitable 400K-oz/yr producer with operations
in Australia, has possibly just completed a successful test of its July-2012 and
February-2013 lows in the A$1.25-A$1.30 range.
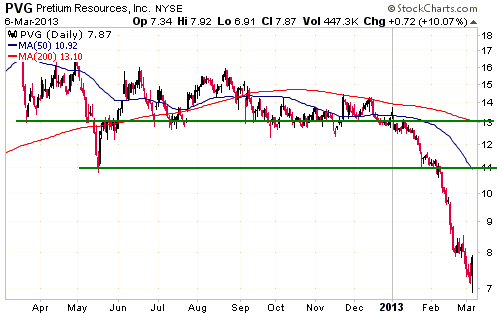
4) Pretium Resource (PVG), an exploration-stage miner with a very high-grade
10M-ounce gold deposit in British Colombia, was pummeled on the stock market
over the past two months despite no negative company-specific developments.
Initial resistance is a long way above the current price.
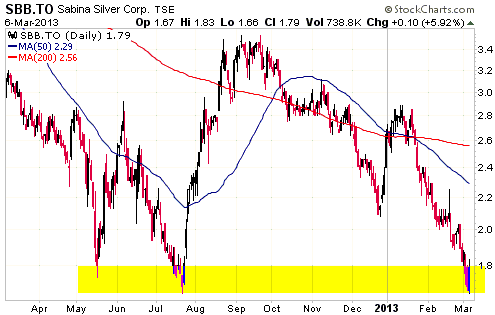
5) Sabina Gold and Silver (SBB.TO), an exploration-stage miner with a high-grade
gold resource and a potentially-valuable silver royalty in Canada's far north,
has possibly just completed a successful test of its 2012 lows.
Gold stocks selling for less than $10/oz
Unless it is in a reasonable jurisdiction and has the potential to be
economically mined with commodity prices at or below current levels, gold in the
ground is not worth very much. So, just because the in-ground resources owned by
an exploration-stage gold mining company are being priced by the market at a
very low level doesn't, by itself, mean that the company is under-valued. By the
same token, when qualitative factors are taken into account it could turn out
that a deposit priced at $50/oz offers much better value than a deposit priced
at $10/oz.
However, as a consequence of just how bad the market for junior gold mining
stocks has become we are now seeing gold deposits with economic potential in
reasonable locations being priced at $10/oz or lower. Moreover, there are now
five such examples within the TSI Stocks List. We are referring to:
1. Batero Gold (BAT.V) - currently being valued at $4/oz
2. Rio Novo Gold (RN.TO) - currently being valued at $9/oz
3. Sandspring Resources (SSP.V) - currently being valued at $5/oz
4. International Tower Hill Mines (THM) - currently being valued at $8/oz
5. Volta Resources (VTR.TO) - currently being valued at $3/oz
These represent extremely low valuations, because in each case the deposit
location is reasonable and there is evidence that the deposit could be developed
into an economically viable mine at the current gold price. We caution, however,
that per-ounce valuations sometimes drop below zero. This happens when companies
with defined resources are valued lower than their net cash, which, in turn, is
a temporary situation most often caused by margin-related selling (when the
margin clerks take over, valuation temporarily means nothing).
Current Market Situation
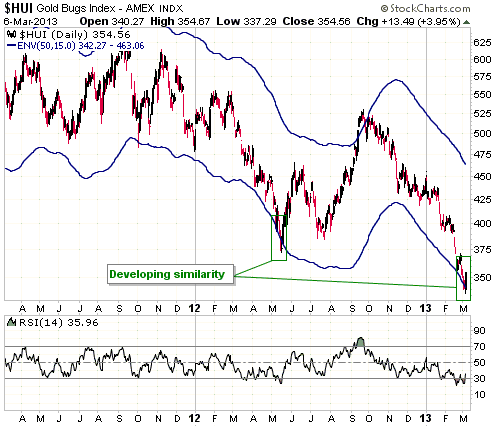
In last week's Interim Update, we wrote:
"...we are close to the end of the decline. However, there isn't yet any
evidence in the price action that a trend change has occurred, which opens up
the possibility that the crash is not yet complete.
Former important HUI support at 373-385 (the shaded area on the following daily
chart) is now important resistance. A daily close above the top of this
resistance-range would be clear evidence that a trend change (from down to up)
had occurred. Evidence of a trend change could also come in the form of a key
intra-day reversal, with the HUI dropping to a new low for the move during the
first two hours of trading and then reversing course to end the day with a gain."
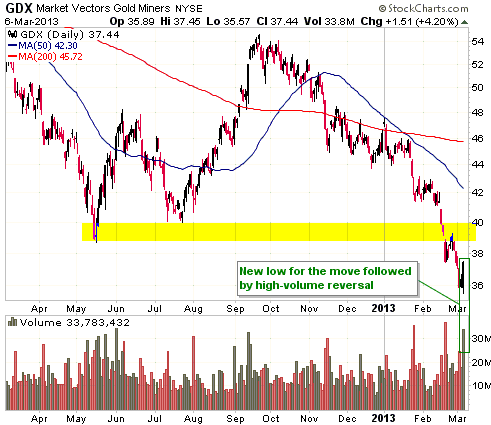
While it is way too early to know that an important low is in place, thanks to
the price action on Wednesday 6th March we now, for the first time in what seems
like ages, have some evidence of a trend change. We are referring to Wednesday's
key intra-day reversal, with the gold-stock indices and most gold-stock ETFs
dropping to new lows for the move during the first two hours of trading and then
reversing course on strong volume to end the day with solid gains. An example is
shown below.
Initial resistance is defined by the 2012 lows.
The following daily chart illustrates the possibility that the HUI is now
bottoming similarly to how it bottomed in May of 2012. The blue lines on the
chart indicate the HUI's 50/15 MA envelope (a 15% envelope around the 50-day
moving average).
Update
on Stock Selections
Notes: 1) To review the complete list of current TSI stock selections, logon at
http://www.speculative-investor.com/new/market_logon.asp
and then click on "Stock Selections" in the menu. When at the Stock
Selections page, click on a stock's symbol to bring-up an archive of
our comments on the stock in question. 2) The Small Stock Watch List is
located at http://www.speculative-investor.com/new/smallstockwatch.html
 Time
to clean house? Time
to clean house?
Consistent with the theme of taking advantage of recent indiscriminate selling
in gold and commodity stocks by replacing relatively high-risk stocks with
relatively low-risk stocks, we've been considering potential replacements for
some of the higher-risk junior mining stocks in the TSI List. At this time we
aren't going to make any changes to the TSI stocks, largely because with the
recent addition of AAU (a stock that was screaming to be included) there is
nothing outside the List that should obviously be in, and with the possible
exception of JAG there is nothing in the List that should obviously be out.
However, here are some stocks that are under serious consideration, along with
the reason(s) they aren't being added yet:
1) Atna Resources (ATN.TO). If ATN's Pinson gold mine in Nevada ramps up roughly
as planned then ATN will generate more than enough cash this year to justify a
doubling of its stock price. However, due to bad experiences in the past we are
now reticent to invest in underground mines during the ramp-up phase. This type
of gold mine has a bad habit of encountering far more problems than anyone
expects.
2) Capstone Mining (CS.TO) is an attractively-valued profitable copper producer
with a very strong balance sheet ($560M of working capital, no long-term debt)
and good growth potential operating in secure jurisdictions. What's not to like?
The only problem we have with CS is that it's a copper producer and we perceive
considerable downside risk in copper. We'd be more comfortable buying exposure
to copper if the copper price were below $3/pound, because then the
intermediate-term upside potential would exceed the downside risk.
3) Golden Queen Mining (GQM.TO) is very tempting at its current price of around
C$1.50. Our problem is that we don't understand why the company has done nothing
about constructing a mine at its Soledad gold-silver project in California. It
is now almost three years since the project became fully permitted, and yet the
company's management has not arranged construction financing and seems content
to just sit back and rejig the mine design over and over again.
4) Midway Gold (MDW). We like MDW a lot at its current price of US$1.06, but we
already have exposure to MDW's projects via the royalties held by Americas
Bullion Royalty Corp. (AMB.TO).
5) Pilot Gold (PLG.TO). We would be looking for an opportunity to add PLG to the
TSI List if the PLG warrants weren't already in the List.
6) PMI Gold (PMV.TO). As mentioned in a recent commentary, PMV could become a
good speculation after it raises the additional money needed to build a mine at
the Obotan project in Ghana. The terms of the financing will be critical.
7) Rio Alto Mining (RIO.TO). RIO is now a very profitable 200K-oz/yr gold
producer, but over the next few years it will transform into a copper producer.
Our nervousness about the copper market stops us from pulling the trigger.
The only change to the TSI List that we are going to make immediately is remove
the Kinross Gold September-2014 $21.30 warrants (K.WT.D), recording a big loss
in the process, and add the Kinross Gold (KGC) January-2015 $15.00 call options.
On Wednesday 6th March the Sep-2014 $21.30 warrants closed at C$0.23 and the
Jan-2015 $15.00 call options closed at US$0.24-$0.32 (0.24 bid, 0.32 ask). This
means that the call options are presently trading at roughly the same level as
the warrants, despite the options having 4 months of additional time to expiry
and a much lower exercise price. We'll add the call options at US$0.28, the
middle of the bid-ask spread.
As long as there's an intermediate-term gold rally within the next 18 months and
Kinross Gold stays in business there should be a good opportunity to exit the
options for a large profit before they expire. It should always be kept in mind
that out-of-the-money options and warrants have downside risk of 100%.
Chart Sources
Charts appearing in today's commentary
are courtesy of:
http://stockcharts.com/index.html
http://bigcharts.marketwatch.com/

|
