![]()
![]()
![]()
![]()
- Interim Update 6th March 2019
Copyright
Reminder
The commentaries that appear at TSI
may not be distributed, in full or in part, without our written permission.
In particular, please note that the posting of extracts from TSI commentaries
at other web sites or providing links to TSI commentaries at other web
sites (for example, at discussion boards) without our written permission
is prohibited.
We reserve the right to immediately
terminate the subscription of any TSI subscriber who distributes the TSI
commentaries without our written permission.
Base metals in short
supply
The reported LME (London Metal
Exchange) inventory for a base metal such as copper is not a reliable
indicator of the overall supply situation for that metal. This is because
there is a lot of supply outside the reporting warehouses and because
reported inventory levels can be manipulated by large traders to paint a
misleading picture. However, when LME inventory levels are very low for
all major base metals at the same time, as is the case right now, it most
likely does indicate a tightness of supply.
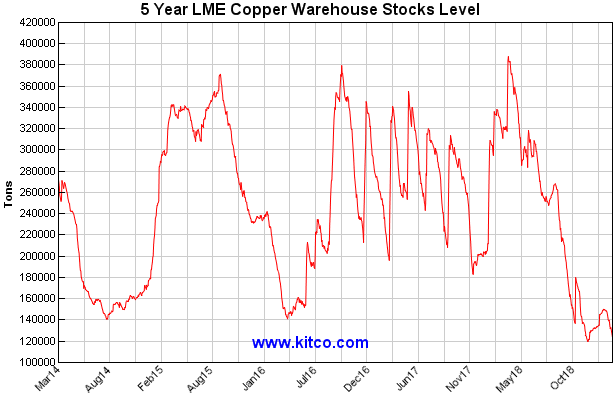
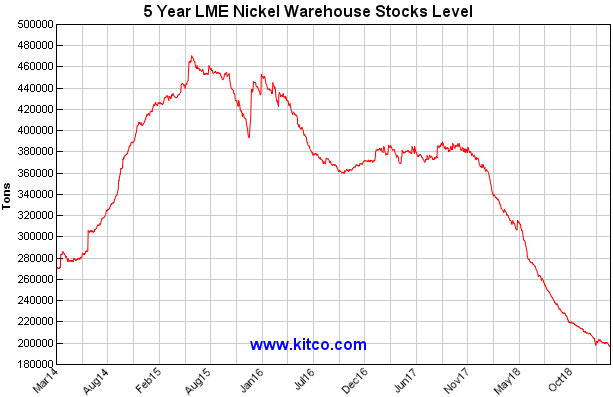
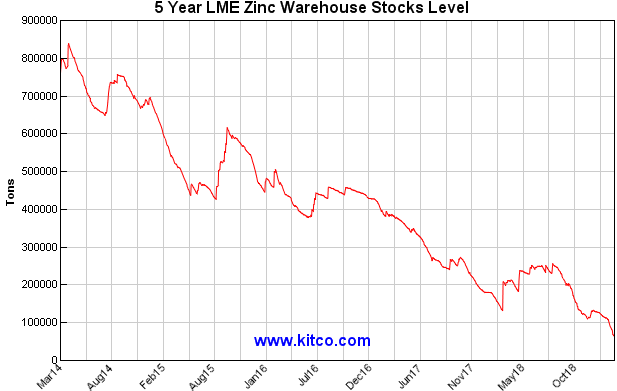
The following charts
show that the LME warehouse stocks of copper, lead, nickel and zinc are at
or near 5-year lows. Furthermore, the LME warehouse stocks of these metals
are at all-time lows when measured in terms of days of global consumption.

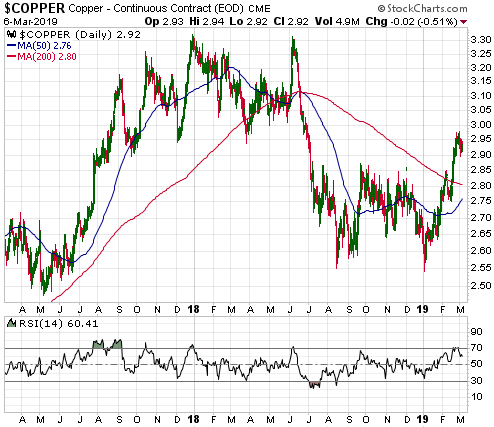
Base metal prices rebounded over the first two months of this year,
partly in response to the low LME inventory levels. A good example is the
copper price, a daily chart of which is displayed below. The copper price
made a marginal new 12-month low at the start of January and then began to
rally.
We expect the combination of a US-China trade deal,
tightness of supply, stock-market stability and a modicum of US$ weakness
to fuel significant additional price gains over the next three months.
As a group, the stocks of base metal producers are currently
'overbought' and acutely vulnerable to near-term weakness in the broad
stock market. In other words, they likely will experience sizable
pullbacks if there's a significant correction in the broad market in the
near future. Given that there probably will be a significant correction in
the broad market in the near future, this is not a good time for new
buying of base metal equities. However, a new buying opportunity could
emerge before the end of this month.
The Stock Market
A long-term valuation
indicator turns down from an extreme
The total market
value of US equities relative to US nominal GDP is called the Buffett
Indicator (BI), because Warren Buffett expressed a liking for it at some
point in the distant past. In Q3-2018 the BI reached a level that was only
ever exceeded at the Q1-2000 bubble top. It then reversed course in
Q4-2018, perhaps marking Q3-2018 as a major valuation peak.
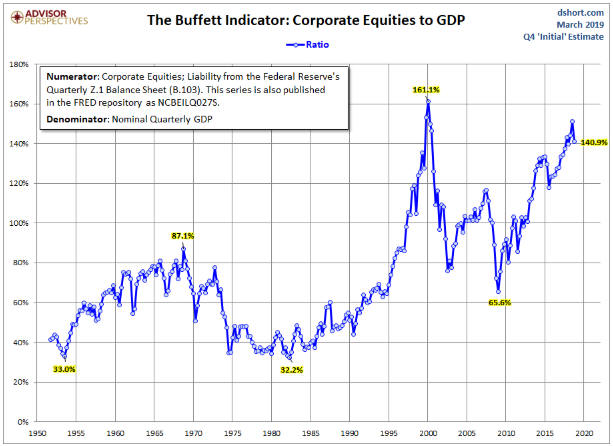
We have two reservations about the BI. The first is that it relies on
GDP, and GDP is not a meaningful economic statistic. The second is that
even if GDP were a valid measure of the US economy's size, it wouldn't
make sense to focus on the market value of US corporate equity relative to
US GDP. The reason is that a lot of US corporate revenue is generated
outside the US. Furthermore, the portion of US corporate revenue that gets
generated outside the US is increasing.
Due to the aforementioned
reservations and the fact that the Q4-2018 reversal in the BI could just
as easily be a 2015-style bull-market correction as the initial decline in
a bear market, we wouldn't hang any hats on the recent performance of this
long-term indicator. We are presenting it for interest's sake only.
Current Market Situation
The SPX pulled back
from lateral resistance over the first three days of this week after first
spiking to a marginal new high. The NYSE Advance-Decline Line (shown in
the lower section of the following chart) remains close to its all-time
high, so this could be nothing more than a minor multi-day consolidation.
However, as discussed below we suspect that it will turn out to be the
start of a meaningful decline.
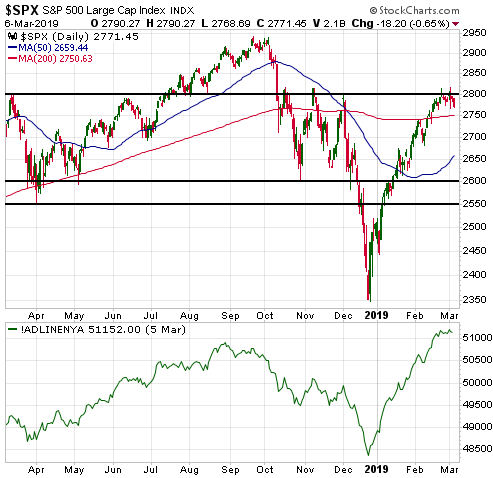
Apart from the senior stock indices being stretched to the upside on a
short-term basis and near/at critical resistance levels, the recent
performances of the Dow Transportation Average (TRAN) and the Russell2000
SmallCap Index (RUT) suggest that the long-awaited multi-week correction
has finally arrived.
As illustrated by the first of the following
daily charts, TRAN has been moving downward for about two weeks. This is
significant because TRAN tends to lead the senior indices at important
turning points. As illustrated by the second of the following charts, RUT
has reversed course in a decisive manner after testing its 200-day MA.
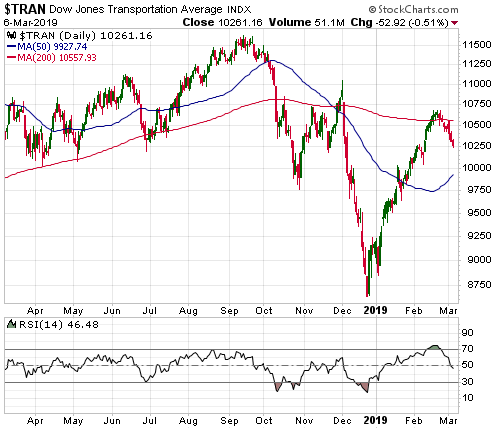
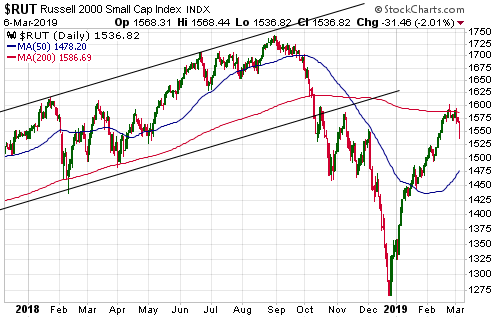
We continue to expect a sizable multi-week pullback followed by a move
to a new high for the year during the second quarter.
Gold and the Dollar
Gold
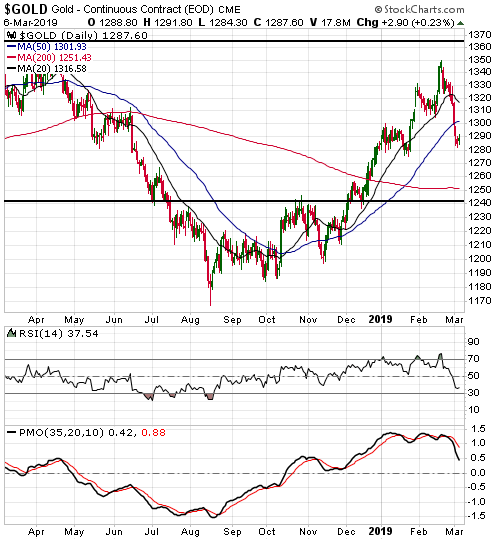
From the "Gold" section of the latest Weekly Update:
"A
short-term rise to the $1400s will remain a good bet provided that
trend-defining support holds during any further corrective activity and
there isn't a pronounced bearish shift in the true fundamentals.
Trend-defining support lies at $1240, but we think that the 200-day MA
will limit the downside over the weeks ahead. Currently, the 200-day MA is
near $1250."
The US$ gold price extended its decline over the
first three days of this week and in doing so broke below its 50-day MA
(the blue line on the following chart). This increases the probability
that a test of the 200-day MA (near $1250) will occur before the
correction is complete.
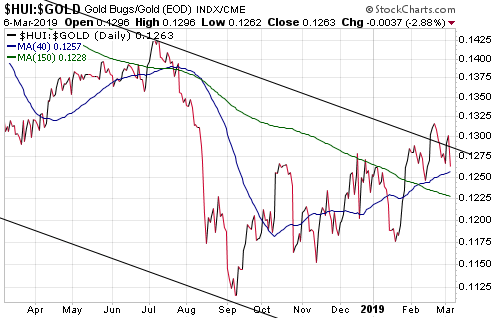
Of importance to the short-term prospects of both gold bullion and the
gold-mining sector, the HUI/gold ratio remains above its 40-day MA. Refer
to the following chart for the details. Be aware, though, that it would
take only a small amount of additional weakness in the HUI relative to
gold to push HUI/gold below this demarcation line.
If HUI/gold
breaks below its 40-day MA it won't imply that a large decline is
underway, but it will be more evidence that we are dealing with a
counter-trend rebound and not a new bull market.
Gold Stocks
The Gold Miners ETF (GDX) showed
some resilience over the first two days of this week, but then fell far
enough on Wednesday to close marginally below its 50-day MA. From our
perspective this didn't change anything, as we expect a test of support at
$20.50-$21.00 prior to the end of the current correction.
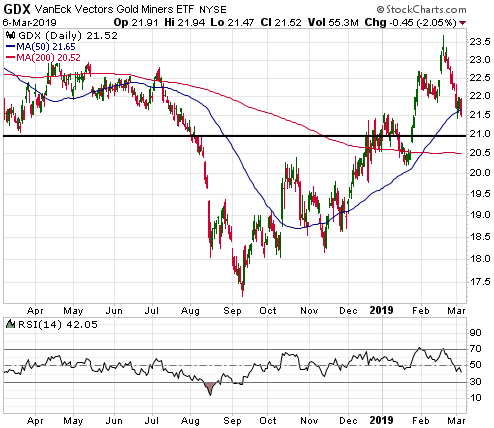
On a long-term basis the gold-mining sector is counter-cyclical and
tends to perform well when the broad stock market is weak, but there are
times when the gold-mining sector is vulnerable to weakness in the broad
stock market. Because the gold-mining indices rose with the senior US
stock indices from mid-January until the second half of February, now is
one of those times.
The Currency Market
Over the past several months most of the major currencies have been
buffeted about by news but have not managed to sustain moves in either
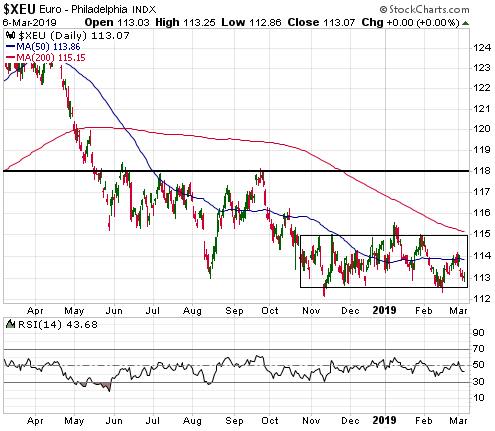
direction. In essence, they have been trendless. Here are three examples:
The euro has traded in a very narrow range since mid-October. It has
been weighed down by the risk of imminent recession in some important
European economies, relative weakness in European equities and the
increasingly-likely possibility that the ECB will delay its first rate
hike until 2020. At the same time, it has been buoyed by the US Fed's
change of heart and a bounce in German bond yields relative to US bond
yields.
Later today the euro will react to the outcome of an ECB
meeting, which probably will involve reacting to news that the ECB intends
to introduce a new Targeted Longer-Term Refinancing Operation (TLTRO - a
program designed to promote increased bank lending).
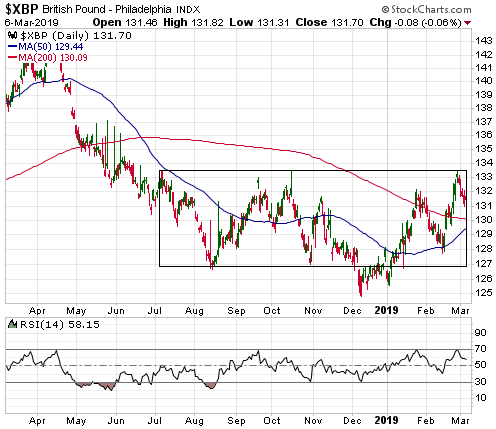
The British Pound has been dominated by Brexit-related news. Since the
start of this year it has strengthened as the chances have improved that
either a slightly-modified Withdrawal Bill will be approved by parliament
or Brexit will be delayed beyond the 29th March deadline, that is, as the
probability of a no-deal Brexit has fallen. However, the lessening risk of
a 'hard Brexit' wasn't enough to break the Pound out of its 8-month range.
Next week is shaping up to be very important for the Pound, as it
could contain as many as three separate Brexit-related votes in the
British parliament. The tentative schedule is for: A vote on 12th March to
approve a modified Withdrawal Bill (essentially the same bill that failed
to gain approval in December, but perhaps with added wording regarding the
"Irish
backstop"). If that fails, a vote on 13th March to approve a no-deal
exit from the EU. And if that fails, a vote on 14th March on whether to
postpone the date for leaving the EU.
If the third vote is
successful, the risk (from the perspective of the pro-Brexit camp) is that
the delay will be used to hold another referendum.
The uncertainty
regarding Brexit makes it difficult to buy the Pound, but we continue to
think that the currency's intermediate-term risk/reward is skewed towards
reward.
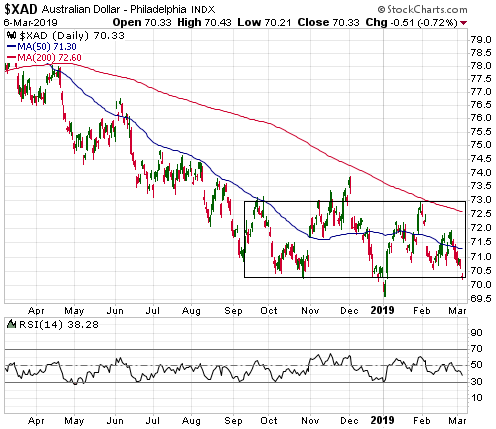
The Australian dollar (A$) has been trying to bottom since October.
There was an attempt to establish an upward trend in November that failed
in December in response to extreme weakness in the prices of industrial
commodities. A second attempt to establish an upward trend failed in
February in response to the feared economic ramifications of political
conflict between Australia and China.
The aforementioned conflict
began with last year's decision by the Australian government to ban
China-based Huawei, the world's largest supplier of telecoms equipment,
from being involved in the roll-out of Australia's 5G network. It also
encompasses allegations of Chinese spying on Australian politicians. Quite
possibly -- albeit not officially -- in retaliation to the actions of the
Australian government, at the beginning of February news hit the wires
that
the Chinese government had imposed restrictions on Australian coal at
the northern Chinese port of Dalian. This was potentially important
because coal is Australia's largest export (in dollar terms) and buyers in
China are collectively the biggest customers of Australia's coal
producers. Then, to make matters worse, about 1.5 weeks ago
China's government announced that it was preparing to slap hefty tariffs
on barley imported from Australia.
A disproportionately large chunk
of Australia's total exports go to China, so any crimping of trade between
the two countries could weaken both the Australian and Chinese economies.
Therefore, it isn't surprising that the coal and barley news put downward
pressure on the A$. Adding to the downward pressure on Wednesday of this
week was news that Australia's GDP growth rate was lower than expected
during the latest quarter.
However, it's bullish that the recent
stream of bad news failed to push the A$ below the bottom of its 6-month
trading range.
Updates on Stock Selections
Notes: 1) To review the complete list of current TSI stock selections, logon at
http://www.speculative-investor.com/new/market_logon.asp
and then click on "Stock Selections" in the menu. When at the Stock
Selections page, click on a stock's symbol to bring-up an archive of
our comments on the stock in question. 2) The Small Stock Watch List is
located at http://www.speculative-investor.com/new/smallstockwatch.html
Chart Sources
Charts appearing in today's commentary
are courtesy of:
https://stockcharts.com/
https://www.kitco.com/
![]()