|
- Interim Update 6th April 2005
Copyright
Reminder
The commentaries that appear at TSI
may not be distributed, in full or in part, without our written permission.
In particular, please note that the posting of extracts from TSI commentaries
at other web sites or providing links to TSI commentaries at other web
sites (for example, at discussion boards) without our written permission
is prohibited.
We reserve the right to immediately
terminate the subscription of any TSI subscriber who distributes the TSI
commentaries without our written permission.
The coming deflation scare
...the
story is unfolding in a way that makes another big deflation scare a
likely prospect within the next few quarters. ... If a deflation scare
did eventuate it would likely have short-term bullish implications for
the dollar and bearish implications for gold.
In the 5th January Interim Update we said: "...if
the various markets do roughly what we expect them to do then another
big deflation scare is probably on the cards for 2005-2006. In
particular, if a) gold and gold stocks experience normal mid-cycle
corrections over much of this year, b) the stock market peaks during
the first quarter of this year and then declines into the next 4-year
cycle bottom (due in the second half of 2006), and c) commodities trend
lower between the second quarter of this year and the third quarter of
2006 in synch with reduced global growth expectations and a
strengthening US$, then deflation fears will once again begin to
dominate the financial landscape. However, it's a very good bet that
the end result of the 2005-2006 deflation scare will be the same as the
result of every other perceived deflation threat of the past 70 years
-- more inflation, one of the main effects of which will be currency
depreciation."
We are now into the fourth month of the year and at this stage the
financial markets are doing roughly what we expected them to do, that
is, the story is unfolding in a way that makes another big deflation
scare a likely prospect within the next few quarters. As mentioned in
previous commentaries, these deflation scares are quite useful as far
as the Fed is concerned because they provide the justification for more
inflation. In fact, inflation confers no benefits whatsoever -- not
even the transitory kind -- if the public recognises the inflation
problem and takes action to protect itself. However, when most people
are unconcerned about inflation or believe deflation to be the bigger
threat then the Fed is free to inflate to the fullest extent of its
powers. That the Fed retains this freedom to inflate is critical
because for every dollar in the world there are several dollars of
debt, the result being that inflation is the lifeblood of today's
monetary system. Or, putting it another way, the current monetary
system is effectively the world's largest-ever "Ponzi scheme" in that
new money must be continually brought in to allow earlier obligations
to be met.
The main difference between genuine deflation and a deflation scare is
that the former is a contraction in the total supply of money whereas
the latter is a psychological reaction to falling prices. In
particular, although a fall in prices that is not preceded by a
reduction in the total supply of money has absolutely nothing to do
with deflation, many people wrongly think that falling prices and
deflation are one and the same. Therefore, whenever there's a
broad-based sell-off in the commodity markets the idea that the country
is headed towards deflation becomes popular and the call goes out to
the Fed to inflate-away the looming threat. The Fed then answers the
call even though genuine deflation was never a serious threat in the
first place.
If a deflation scare did eventuate it would likely have short-term
bullish implications for the dollar and bearish implications for gold.
The reason is that inflation expectations would almost certainly start
to fall BEFORE the Fed had completed its rate-hiking campaign, meaning
that there would be a brief period -- a few months, perhaps -- when
real US interest rates* were rising quite sharply. However, gold would
likely begin its next major advance as soon as the market sensed that
the Fed, in response to the deflation scare, was about to shift from a
modestly restrictive monetary stance to an extremely loose one.
As far as the debt markets are concerned, the thing we can say with the
greatest amount of confidence is that the outcome of a deflation scare
would be a flight to quality. In other words, a highly probable outcome
would be an across-the-board widening of credit spreads
(under-performance by emerging market debt relative to US Treasury
debt, high-grade corporate debt relative to US Treasury debt, and
low-grade corporate debt (junk bonds) relative to high-grade corporate
debt). We can also confidently predict that the Fed would make an
about-face soon after the markets began to agonise over the prospect of
deflation. In fact, the way things are panning out there's a good
chance that the next official rate-CUTTING campaign will begin before
year-end.
Although US Treasury bonds would likely perform well relative to almost
all other bonds during a deflation scare, we don't have a strong
opinion on how they would perform in absolute terms. A lot, we suspect,
will depend on what the market does over the coming 2-3 months. A sharp
sell-off in the T-Bond market during the next couple of months, for
example, would set the scene for a powerful rally over the remainder of
the year.
*The real interest rate is the nominal interest rate minus the EXPECTED inflation rate
The US
Stock Market
The Nikkei Model
At this stage we prefer the "1970s Model" to the "Nikkei Model"...
In the latest Weekly Market Update we re-visited the "1970s Model" for
the US stock market. This model is based on the idea that today's
market is following a similar path to the one taken by the market
during 1972-1974.
The "1970s Model" took centre stage in our analysis last September when
the odds shifted in favour of the market breaking out to the upside
from the range in which it had traded since the first quarter of the
year. Furthermore, the potential for today's market to experience a
downturn during 2005-2006 that was roughly equivalent to the 1973-1974
downturn was underlined by a few significant political, economic and
geo-political similarities between 1972 and 2004.
Prior to last September, however, we had been favouring the "Nikkei
Model". Specifically, our thinking had been that the performance of the
Japanese stock market during 1994-1996 represented a rough outline of
what we could expect from the US stock market over the ensuing two
years. For old times' sake let's now take another look at the Nikkei
Model.
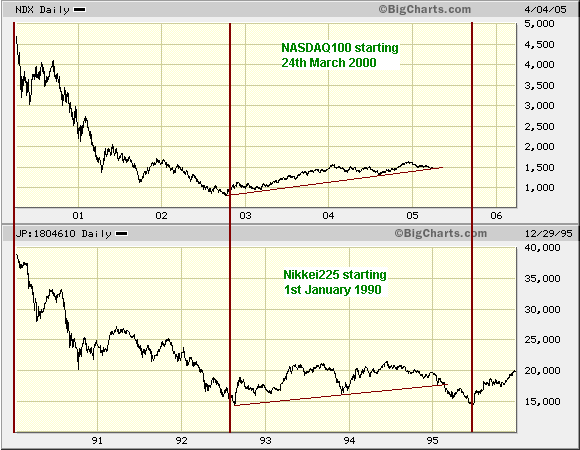
Below is a chart comparison of the post-bubble Nikkei and the
post-bubble NASDAQ100 (NDX). Both charts begin at the day of the bubble
peak and extend for 6 years. Interestingly, the charts suggest that
although the NDX's move to a new recovery high during the final quarter
of last year was a deviation from the Nikkei Model, the model might
still be valid.

It is quite
reasonable to have a roadmap in mind when contemplating the future
performance of any market, but it's critical not to be married to any
view of how the story will unfold. In other words, you must be willing
to adopt a new outlook if the facts no longer support your current one.
At this stage we prefer the "1970s Model" to the "Nikkei Model" because
the former is in synch with the 4-year Presidential Cycle and meshes
with our views on other markets. Also, we think there are more
similarities between the US of 1973 and the US of today than there are
between Japan of 1995 and the US of today. In any case, the only real
difference between the two models is in the speed of the decline back
to the October-2002 lows. For example, if the US stock market were to
experience a fast-enough decline over the coming several months to take
the NDX back to near its October-2002 low by the final quarter of this
year then the odds would shift strongly in favour of the "Nikkei
Model".
Current Market Situation
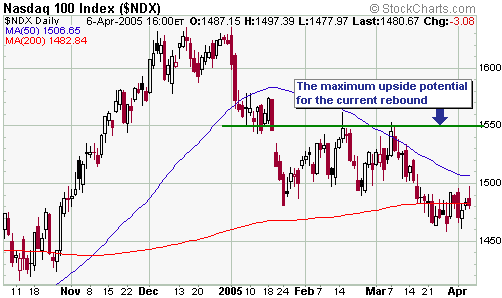
The below chart of the NASDAQ100 Index (NDX) shows that the market is
working off its 'oversold' condition via a modest upward drift. This is
bearish and supports our view that the next big move will be to the
downside. Further consolidation is likely over the coming 1-2 weeks
with resistance at 1550 being our assessment of the NDX's maximum
near-term upside potential. The 50-day moving average is, however, a
more reasonable upside goal for the rebound.

During February and
March we said to allow for the possibility that the Semiconductor Index
(SOX) would manage a short-lived surge above resistance at 450 before
commencing a large decline. The chances of such an upside breakout are
now lower than they were, but note that triple tops are rare so a move
back to around 450 would almost certainly lead to a breakout above
resistance.
Gold and
the Dollar
The US$ and US debts
...we
are long-term dollar bears so we clearly don't accept the idea that the
current high level of US indebtedness will turn out to be a significant
positive for the US currency.
US$ bears regularly point towards the massive public- and
private-sector debt levels in the US as reasons to expect a much weaker
dollar. Debts that have already been accumulated do not, however, exert
any direct downward pressure on the dollar. In fact, the high debt
levels constitute a potentially positive influence on the dollar's
value relative to other currencies and tangible assets because these
existing debts represent obligations to obtain dollars in the future;
in other words, all else being equal these debts will increase the
future demand for US dollars. This is the essence of a theory developed
by Bob Hoye many years ago and subsequently embraced by a few other
analysts including Richard Russell.
Now, we are long-term dollar bears so we clearly don't accept the idea
that the current high level of US indebtedness will turn out to be a
significant positive for the US currency. Our reasoning is summarised
below.
There are three ways in which the size of the US debt burden could be
reduced. The first way would be for borrowers to incur the bulk of the
repayment cost by cutting back on their expenditure and allocating
every spare dollar to the repayment of debt. This would increase the
demand for currency and simultaneously reduce its total supply,
resulting in substantial upward pressure on the dollar and a severe
recession. The second way would be for lenders to incur the bulk of the
repayment cost by writing off a large portion of their outstanding
loans. This would ultimately lead to a lower supply of dollars and,
therefore, a higher dollar. But once again it would result in a severe
recession due, in part, to the collapse in asset prices that would
occur when lenders re-possessed and sold the assets that had originally
been posted as collateral for the written-off loans. The third way
would be for the bulk of the repayment cost to be passed along to
everyone in such a surreptitious and gradual way that most people
wouldn't realise what was happening until it was too late. That is, for
the extent of the debt burden to be reduced via inflation.
We have little doubt that the US monetary authorities will choose the
third way because doing so would allow the illusion that everything is
OK to be maintained for as long as possible. And in any case, given the
"Ponzi scheme" nature of the current monetary system they don't really
have a choice. In fact, it is clear to us that the US monetary
authorities have ALREADY chosen the third way. THIS is why we aren't
anticipating any dollar strength, especially relative to gold, beyond
the intermediate-term.
Current Market Situation
In the latest Weekly Update we mentioned that last Friday's performance
by the dollar in the wake of a weak US monthly employment report was
very similar to its performance following weak employment reports in
early-January and early-February. We also noted that a continuation of
the similar trading pattern would result in the dollar peaking by this
Tuesday and then pulling back.
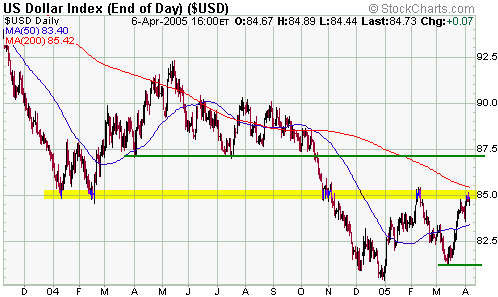
The below daily chart of the Dollar Index shows that the recent rally
has resulted in a test of hefty resistance at around 85. This
resistance is most likely going to be breached within the next several
weeks, but perhaps not until after an intervening
pullback/consolidation. It is possible that an interim peak was put in
place on Tuesday in line with the post-employment-report pattern
mentioned above and that such a pullback has begun. A normal pullback
within an on-going upward trend would take the Dollar Index back to
near its 50-day moving average.

The pound/euro ratio
generally trends in the same direction as the Dollar Index and often
leads the dollar at important turning points. The below chart shows
that pound/euro continues to support the short-term bullish case for
the dollar.
If the dollar were to
consolidate its recent gains over the coming 1-2 weeks then gold would
probably move back into the 430s. Note, though, that it's very unlikely
that gold has already bottomed for the year.
Gold Stocks
Current Market Situation
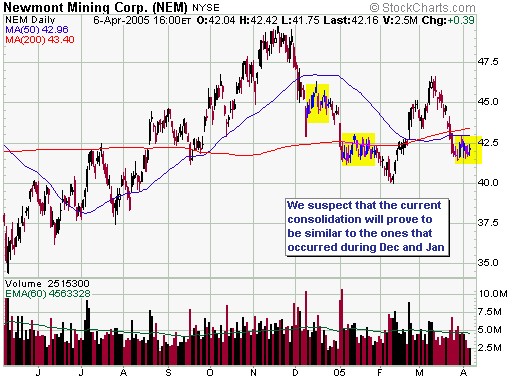
With reference to the below chart of Newmont Mining (NEM), we suspect
that the gold sector is currently experiencing a short-lived
consolidation similar to the ones that occurred during December and
January. We remain short- and intermediate-term bearish on the gold
sector, but think the odds are in favour of a modest amount of
additional upside over the coming 1-2 weeks.

South African Gold Stocks
Some of the problems facing the major South African gold producers
include low/falling profit margins due to a combination of the
depressed Rand gold price and escalating costs, industrial action (the
workers at one of Harmony's largest operations have gone on strike and
there are likely to be more strikes over the next few months as part of
the process of negotiating new wage/benefit deals), and a government
intent on following a socialist agenda that involves redistributing
mining wealth. Although the problems with the unions and the government
are not likely to disappear in the foreseeable future, we expect that
the SA gold stocks will turn into relative-strength leaders once the
market starts to believe that a major advance in the Rand gold price
has begun.
As things currently stand, the Rand gold price remains within the midst
of a drawn-out basing pattern (see chart below). A decisive move above
2800 would be a clear sign that an intermediate-term advance was
underway.

Update
on Stock Selections
 We
mentioned in previous updates that one of the most likely results of
DRDGOLD's (NASDAQ: DROOY) financial dilemma wasn't that the company
would go bust, but that the interests of existing shareholders would
get diluted via an equity issue. Dilution was almost inevitable and it
has begun via an issue of 33M new shares at R5.5 per share (around
US$0.90 per share at the current Rand/US$ exchange rate). We see this
as a minor positive because although it will result in a 13% increase
in the total number of outstanding shares the overriding consideration
for the company is to stay in business long enough to benefit from the
increase in the Rand gold price that is likely to occur over the coming
12-18 months. We
mentioned in previous updates that one of the most likely results of
DRDGOLD's (NASDAQ: DROOY) financial dilemma wasn't that the company
would go bust, but that the interests of existing shareholders would
get diluted via an equity issue. Dilution was almost inevitable and it
has begun via an issue of 33M new shares at R5.5 per share (around
US$0.90 per share at the current Rand/US$ exchange rate). We see this
as a minor positive because although it will result in a 13% increase
in the total number of outstanding shares the overriding consideration
for the company is to stay in business long enough to benefit from the
increase in the Rand gold price that is likely to occur over the coming
12-18 months.
Chart Sources
Charts appearing in today's commentary
are courtesy of:
http://stockcharts.com/index.html
http://www.futuresource.com/
http://bigcharts.marketwatch.com/

|

