|
- Interim Update 6th April 2011
Copyright
Reminder
The commentaries that appear at TSI
may not be distributed, in full or in part, without our written permission.
In particular, please note that the posting of extracts from TSI commentaries
at other web sites or providing links to TSI commentaries at other web
sites (for example, at discussion boards) without our written permission
is prohibited.
We reserve the right to immediately
terminate the subscription of any TSI subscriber who distributes the TSI
commentaries without our written permission.
Ackerman attacks a straw man
As explained at Wikipedia: "To
"attack a straw man" is to create the illusion of having refuted a
proposition by substituting it with a superficially similar yet
unequivalent proposition (the "straw man"), and refuting it, without
ever having actually refuted the original position." In his article "Big Gap in Logic Weakens Hyperinflation Argument",
Rick Ackerman sets up a "straw man" and then assails it in an effort to
show that deflation is the most likely outcome. The "straw man", in
this case, is the presentation of the inflation-deflation issue as if
hyperinflation and deflation were the only possible outcomes. If
everyone who is predicting more inflation could be lumped into the
'hyperinflation camp', then all inflation forecasts could be neatly
discredited by discrediting the hyperinflation argument.
A few smart analysts think that hyperinflation has a decent chance of
happening within the next couple of years, but most
economically-literate inflation forecasters are not anticipating such
an outcome. For example, we have consistently predicted inflation over
the past decade, but never at any stage over this period have we
thought that hyperinflation was an imminent threat in the U.S. (where
"imminent threat" means one that is likely to materialise within the
ensuing two years). Over the next two years there will very likely be
more inflation -- regardless of whether inflation is correctly defined
as an increase in the True Money Supply or incorrectly defined as an
increase in the general price level -- but there is little chance of
the broad-based skyrocketing of prices that people typically associate
with hyperinflation.
So, we aren't expecting hyperinflation to happen anytime soon. That's
not, however, because there are big logic gaps in the hyperinflation
argument. Hyperinflation may well be a low-probability outcome as far
as the next two years are concerned, but it is certainly not an
impossible outcome as suggested in the above-linked article. We'll now
deal with some of the errors in the article and briefly explain why/how
hyperinflation could occur.
Ackerman's case against hyperinflation is encapsulated by the following quote:
"Hyperinflation would
require the shifting of cash money into physical goods. But other than
mattress money and the relatively paltry sums of cash on hand at branch
banks, there would be precious little cash to dump. And if the
money is to come out of Treasurys and other paper assets, how much will
that paper fetch on the day when there are no buyers other than the
Federal Reserve?"
In summary, he doesn't believe that there will be enough "cash" to
allow Americans to bid the prices of hard assets to extremely high
levels.
One problem with his analysis is that when talking about the economy's
cash supply he only considers the relatively small paper float.
However, all the money that resides in checking and savings accounts
can be turned into paper upon demand. If the banks don't have enough
paper cash to fulfill demand, then the Treasury will print more. In any
case, people can buy 'stuff' without laying their hands on paper money.
They do it every day.
Another problem is revealed by the phrases "...the shifting of cash money into physical goods..." and "...if the money is to come out of Treasurys and other paper assets...".
The reality is that money never shifts into or comes out of any
investment. All the money in the economy is always held by someone,
with ownership of money changing hands when anything is traded for
money. To put it another way, money gets transferred between buyers and
sellers when trades take place. Before the trade, one party holds the
money. After the trade, another party holds the money. The sale of $10M
of Treasurys, for example, involves the transfer of $10M from the buyer
to the seller (the seller ends up with 10M more dollars in his bank
account, the buyer 10M less). No money goes into, or comes out of, the
treasury market as a result of this transaction.
An implication of the above paragraph is that ALL the money in the
economy is ALWAYS available to bid up prices. Consequently, if the
current holders of money decided, en masse, that they would much rather
have tangible assets than money, then the prices of these assets could
rise sharply without any increase in total money supply. In this case,
rising prices would reflect falling demand for money (a reduction in
the desire to hold money).
That being said, in the real world of legal tender laws, taxation and
debt repayment obligations, there is a limit to how far prices could
rise without a concomitant rise in money supply. In other words, under
today's set of circumstances a broad-based moon-shot in prices couldn't
occur solely as a result of a plunge in the demand for money. Our point
is simply that changes in the demand for money must be taken into
account.
The gist of the above is that Ackerman a) greatly under-estimates the
amount of money that is already available to bid up prices, and b)
fails to acknowledge the price-related effects of falling demand for
money. It's true, though, that a further large increase in the money
supply would be required before hyperinflation could become an imminent
threat. Strangely, given what has happened in front of his eyes over
the past 2.5 years, he can't imagine where this extra money would come
from.
All the forecasters of deflation that we know of downplay the Federal
Reserve's power to inflate. The Fed is an extremely powerful and an
extremely dangerous organisation, primarily because it has the ability
to create an unlimited amount of new money. Moreover (to anticipate a
popular objection), it most definitely has the ability to get new money
into 'circulation'.
The distasteful truth is that there are no rigid restrictions on what
assets the Fed can monetise (purchase with money created out of
nothing). Up until now the Fed has restricted its monetisation to
Treasury debt, Agency debt and Mortgage-Backed Securities, which means
that the money it has created has gone into circulation via the
government (the government spends all the money it borrows into
existence) and the previous owners of the bonds purchased by the Fed.
In such cases the new money starts with the government and the sellers
of bonds, and begins to work its way through the economy after the
government spends the proceeds of its borrowing and the sellers of
bonds spend/invest the proceeds of their bond sales. Note, though, that
at some future time the Fed could choose to monetise houses, thus
putting money directly into the hands of the general public and
shortening the time between monetary inflation and the resultant "price
inflation".
Now, the Fed doesn't want to destroy the dollar, which is why it
simultaneously promotes inflation and pretends to fight inflation. The
Fed is therefore not going to start buying up houses anytime soon.
Instead, at each step along the way it will attempt to do as much as,
but no more than, necessary to keep the money supply expanding at what
it deems a healthy pace. Eventually, keeping the money supply expanding
could require something unprecedented such as the monetisation of
houses, at which point hyperinflation would be a clear and present
danger.
Finally, if you think that the Fed would never become so cavalier and
profligate as to monetise residential property, consider that the Fed
is routinely doing things today that would have seemed out of the realm
of possibility just five years ago.
Has an indicator outlived its usefulness?
The
Baltic Dry Index (BDI) is an indicator of international ocean-going
freight rates. For decades, it also served well in a secondary role as
an indicator of global trade and important currency market turning
points. Considering its performance over the past two years, it is
reasonable to question whether it is still capable of fulfilling this
secondary role.
The following chart shows that the BDI has trended downward since
November of 2009, and that earlier this year it dropped to near the
lows reached at the climax of the Global Financial Crisis. This large
decline has occurred in parallel with rising commodity prices and a
weakening US$, the opposite of what would be expected based on the
long-term historical record.
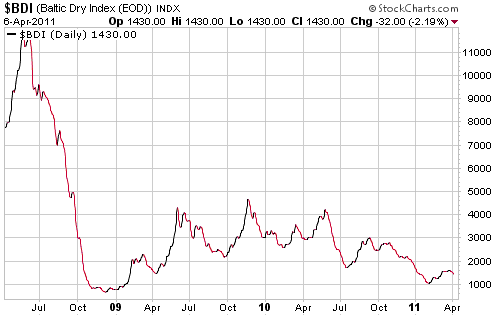
It's possible that the BDI will find a lower range in which to
oscillate and once again become a useful financial-market indicator,
but there doesn't appear to be a good reason to pay attention to it at
the moment.
The Stock Market
The
senior stock indices gained some additional ground over the first three
days of this week, but they are essentially still in the same position
they were in at the end of last week: at resistance, but not yet
'overbought' beyond the very short-term.
Gold and
the Dollar
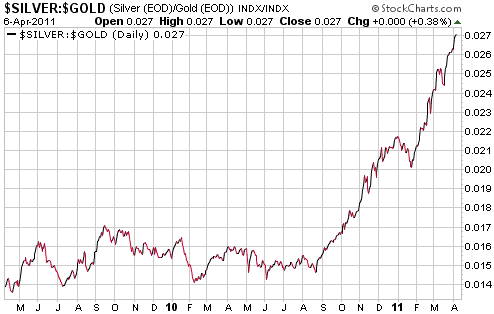
Gold and Silver
From the latest Weekly Update:
"Gold didn't manage to
break out last week, but the odds are in favour of it doing so in the
near future. One of the main reasons is that the silver/gold ratio
ended last week at a new multi-year high. As long as the silver/gold
ratio remains in a short-term upward trend it will be reasonable to
assume that new highs lie ahead for both gold and silver."
Gold did manage to break out to the upside during the first half of
this week. Moreover, the following daily chart shows that the
silver/gold ratio ended Wednesday's session at a new high for the move.
It is therefore reasonable to assume that both gold and silver are
going to make additional upward progress in the near future.
$1500 is the obvious
2-5 week price target for gold. If it gets past $1500, then $1600 (the
next big round number) will become a plausible near-term price target.
Support should be found in the $1430s on any pullback over the next
several days.
Cycle analysis points to the first half of May (the 5-year anniversary
of the important 2006 peak) as a likely time for the current rally to
culminate.
The above-mentioned price and time targets are just guesses. Rather
than trying to guess when and at what level the gold price is going to
reach its next intermediate-term top, it makes more sense to use
real-time analysis to identify topping action. As we've mentioned many
times, the next intermediate-term tops in the prices of gold and silver
will almost certainly be marked by a pronounced downward reversal in
the silver/gold ratio. Another way of saying this is that silver led on
the way up and will almost certainly lead on the way back down.
Note that there are two ways that the silver/gold ratio could indicate
a top. One is to plunge by more than 7%. Another is to diverge
bearishly from the prices of gold and silver over a period of at least
two weeks (a bearish divergence would involve gold and silver making
new highs while the silver/gold ratio made lower highs).
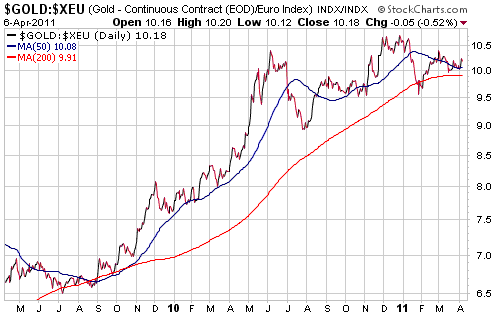
In addition to the US$ prices of gold and silver, we are paying close
attention to the euro-denominated gold price (gold/euro). Gold/euro
should make new highs over the weeks ahead, but the following daily
chart reveals that at this stage it remains comfortably below last
year's high. Failure by gold/euro to confirm the new highs in the US$
gold price within the next few weeks would constitute a meaningful
bearish divergence.
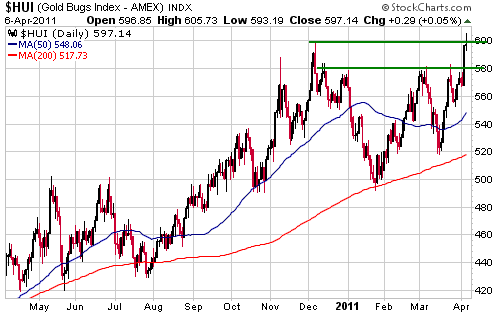
Gold Stocks
The HUI blasted above resistance at 575-580 on Tuesday and is now
challenging resistance at 600. Further to what we've said in earlier
commentaries, Tuesday's solid break above 580 creates a short-term
chart-based target of around 670.
Former resistance at 575-580 should now act as support during any pullback over the next several days.
We thought it was
interesting that Monday's announcement of a takeover bid by New Gold
(NGD) for an exploration-stage gold miner named Richfield Ventures
(TSXV: RVC) didn't prompt meaningful speculation in other
exploration-stage gold mining stocks. It was interesting because the
price that NGD is paying for the privilege of getting its hands on
RVC's Blackwater project (NGD has agreed to pay around $130 per total
in-ground resource ounce) implies that many other exploration-stage
gold miners are substantially under-valued. However, some of the most
likely future takeover targets made good gains on the next trading day.
Of the gold and silver stocks in the TSI List, the most likely candidates for a takeover bid are CFO.V, KGN, SBB.TO and THM.
Currency Market Update
The government of Portugal has become the latest euro-zone government
to seek a bailout in order to save its bondholders. This has been
widely expected for some time.
After being shaken by Greece's bailout last year, the currency market
has taken this year's bailouts of Ireland and Portugal in stride. At
this stage the market does not expect that the government of Spain will
require a bailout. We expect that the market will be proven wrong and
that Spain will eventually go the way of Greece, Ireland and Portugal.
The following weekly chart shows that the Dollar Index is continuing to
probe lateral support defined by its November-2010 low. Just below
that, there is support defined by the November-2009 low.
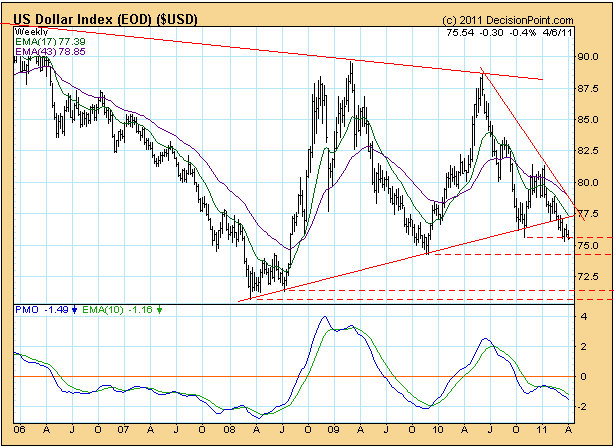
As mentioned in
previous commentaries, a pronounced downward reversal in the
silver/gold ratio would probably be a reliable signal that the Dollar
Index had commenced a bottoming process.
Update
on Stock Selections
(Notes: 1) To review the complete list of current TSI stock selections, logon at http://www.speculative-investor.com/new/market_logon.asp
and then click on "Stock Selections" in the menu. When at the Stock
Selections page, click on a stock's symbol to bring-up an archive of
our comments on the stock in question. 2) The Small Stock Watch List is
located at http://www.speculative-investor.com/new/smallstockwatch.html)
 The email alert
sent earlier this week advised that we were removing Duoyuan Global
Water (DGW) and Minefinders Corp. (MFN) from the TSI Stocks List. The email alert
sent earlier this week advised that we were removing Duoyuan Global
Water (DGW) and Minefinders Corp. (MFN) from the TSI Stocks List.
New
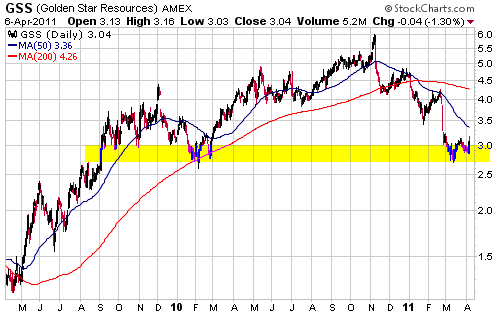
TSI stock selection: Golden Star Resources (NYSE: GSS), Shares: 259M
issued, 265M fully diluted (excluding convertible debentures, which are
currently well out of the money). Recent price: US$3.04
We don't have time right now to do a detailed write-up of GSS, but
we've mentioned it in several previous commentaries so most of our
readers are probably familiar with the story.
In a nutshell, GSS is a mid-tier gold producer with operations in
Ghana, West Africa. It is slated to produce about 350K ounces of gold
in 2011 at a relatively high "cash cost" of around $835/oz. The high
cost of GSS's production creates operational risk, but it also means
that the company's operations offer substantial leverage to the gold
price. Importantly, the downside risk in the stock price has been
mitigated by the fact that the shares have suffered a large decline and
now trade at a very low valuation (its annual production and in-ground
resources are presently being valued at $2300/oz and $90/oz,
respectively).
GSS's balance sheet is in reasonable shape, in that long-term debt of
$156M is more than offset by cash of $178M (as per the latest audited
accounts).
In addition to offering leverage to additional gains in the gold price,
GSS shares have the potential to rebound strongly if management can
demonstrate an operational turnaround.
GSS's chart (see below) shows that the stock has strong support at
US$2.75-$3.00. The bottom of this support range probably defines the
short-term downside risk. As far as the reward side of the equation is
concerned, if gold is able to build on this week's upside breakout then
GSS could quickly rebound to the mid-$4 area.
We have added GSS to the TSI Stocks List at Wednesday's closing price of US$3.04.
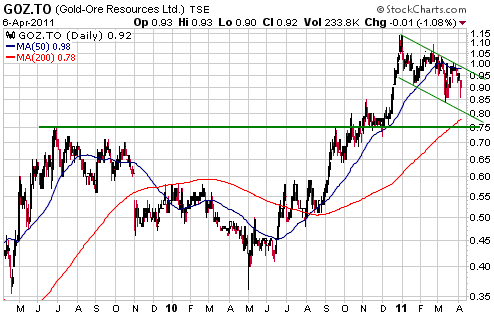
Gold-Ore Resources (TSX: GOZ). Shares: 83M issued, 89M fully diluted. Recent price: C$0.92
Junior Sweden-based gold producer GOZ is a good candidate for new
buying near its current price or lower. The chart for this profitable
45K-oz/yr producer reveals strong support at C$0.75-C$0.80, which
probably defines the short-term downside risk. Going the other way,
C$1.50 remains our valuation-based target.
A daily close above C$1.00 would suggest that the stock was on its way to the aforementioned target.
International Tower Hill Mines (AMEX: THM, TSX: ITH). Shares: 85M issued, 90M fully diluted. Recent price: US$10.23
In the 2nd March Interim Update we said that THM, an exploration-stage
gold miner with a large (12M-ounce) deposit in Alaska, would be a
strong buy if it pulled back to the low-US$8 area. The stock
subsequently traded as low as US$8.00, thus creating a good buying
opportunity. It has since rebounded to just above US$10, which means
that there is about $2 less upside potential now than there was when
the stock reached its correction low last month.
Speculators interested in buying THM shares should ideally have bought
last month, but the potential exists for significant additional gains
in both the short-term and the long-term. Significant additional
short-term gains would be driven by increasing enthusiasm for large
undeveloped gold deposits in response to the breakout in the gold
price, as well as by the touting of Jim Cramer (Cramer 'discovered'
this stock about a week ago and will probably mention it a few more
times to his millions of followers over the weeks ahead if gold
continues to act in a bullish manner).
Assuming that the short-term gold outlook remains bullish, any pullback
in THM will probably do no more than take its price back to the
mid-US$9 area.
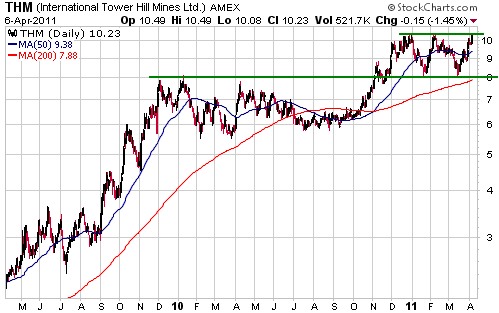
Chart Sources
Charts appearing in today's commentary
are courtesy of:
http://stockcharts.com/index.html
http://www.decisionpoint.com/

|
